
Social Media Analytics: The Metrics That Matter and How to Read Them


Every guide to social media analytics you have read follows the same shape: a definition, twenty metrics in four buckets, then a roundup of eleven tools with pricing. What none of them tell you is that the single number sitting at the top of your report, total views, is made of seven incompatible units that cannot legally be added together. YouTube counts a view at the first frame. Meta's ThruPlay wants fifteen seconds. LinkedIn wants two continuous seconds at half the player on screen. TikTok excludes replays; Instagram includes them. Your dashboard prints one column anyway.
That is not a rounding problem. It is the difference between a format you should double down on and a format you should quietly retire. And it got worse in the last two years, not better: Meta deprecated Instagram's impressions metric for anything created after 2 July 2024, and YouTube redefined a view on 24 August 2026. The reach-versus-impressions framing most guides still teach describes a world that no longer exists on one of the biggest platforms in it.
This guide is built as a workflow, not a list. Seven milestones, in the order you should actually do them: fix your definitions, learn the counting rules, stop summing across platforms, attach a threshold to every decision, check your sample size, audit what your tool is doing to your numbers, and report from native analytics honestly. Every platform claim below links to the primary documentation.
Milestone 1: Define what you are measuring, without the fog
Social media analytics is the practice of collecting performance and audience data from social platforms and using it to decide what to do next. That last clause is the whole job. Data you gather but never act on is reporting, not analytics.
Academic and enterprise sources split the work into four layers, and it is worth knowing the vocabulary because it tells you what a given number can and cannot do:
- Descriptive: what happened. Your reel got 12,400 views last week.
- Diagnostic: why it happened. It got them because 71% of the views came from a single audio trend, not from your followers.
- Predictive: what is likely next. Reels using that audio decay within nine days, so expect the follow-up to underperform.
- Prescriptive: what to do. Publish the follow-up within four days or change the hook.
Most dashboards are stuck at descriptive and charge you for diagnostic. "Social media data analytics" is the same activity described from the data side rather than the marketing side: the pipeline of pulling platform data via APIs, normalizing it, storing it, and querying it. The distinction matters mainly when you are building rather than buying, which is where the counting rules below become load-bearing.
Milestone 2: Learn how each platform counts a view, an impression, and reach
This is the section no ranking page carries, so read it once and keep it. Every claim below comes from the platform's own documentation, checked as of August 2026.
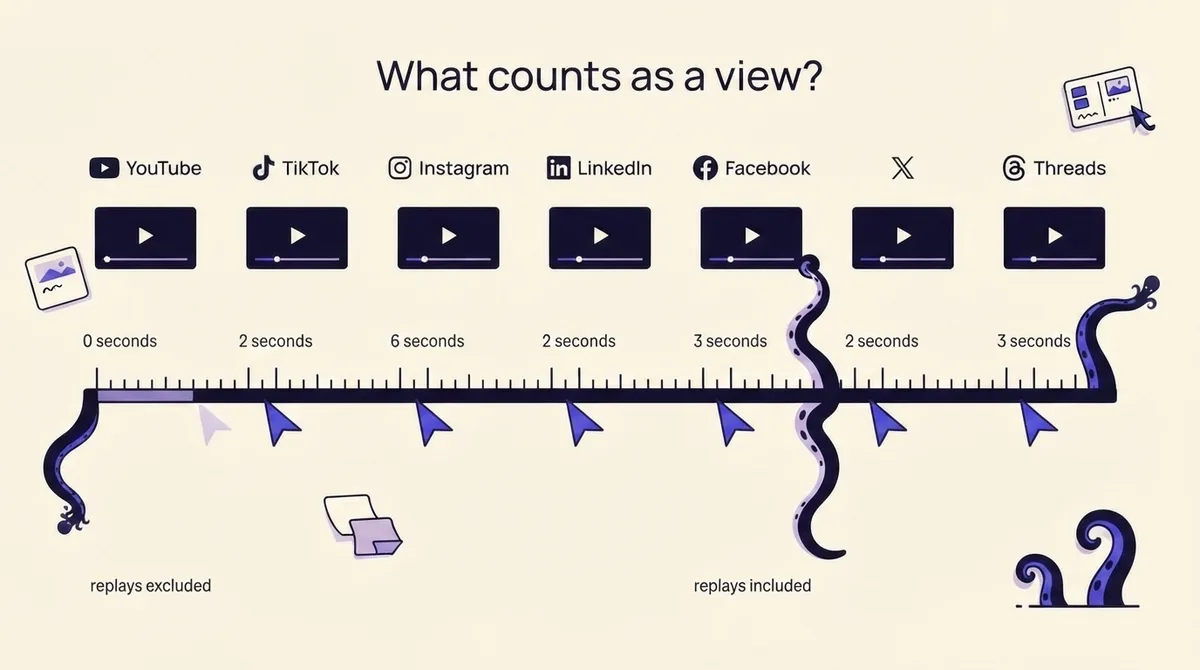
YouTube (changed 24 August 2026). A view is now counted the moment a video starts to play, across all formats: Shorts, long-form, podcasts and live. The older, stricter definition has been renamed engaged view, defined as watching past that initial first frame or clicking to watch. Partner Program earnings and eligibility still run on engaged views and did not change. If your YouTube view counts jumped in late August 2026, that is the reason, and your year-over-year comparison is broken. (blog.youtube)
TikTok. A Video View is the number of times your video started to play, and replays are excluded. TikTok also publishes tiered metrics: 2-Second Video Views (at least two seconds in an impression session, replays excluded), and a 6-Second Focused View, which counts at six seconds, or a full play if the video is shorter than six seconds, or any interaction initiated within the first six seconds. The same rule structure applies at fifteen seconds. Even TikTok's "views at 100%" excludes replays. (ads.tiktok.com)
Instagram. Views is the total number of times the media has been played. Reach is the number of unique accounts that saw the reel at least once, and Meta labels reach an estimated metric, not an exact count. Critically, impressions is deprecated for media created after 2 July 2024 and survives only for older media. Instagram's watch-time metric, ig_reels_video_view_total_time, explicitly includes time spent replaying. So TikTok excludes replays and Instagram includes them: the same fifteen-second clip cross-posted to both will not produce the same unit, ever. (developers.facebook.com)
One more Instagram trap: total_interactions is likes, saves, comments and shares minus unlikes, unsaves and deleted comments. Instagram engagement can fall retroactively, which means a report you exported on Monday will not reconcile with the same report exported on Friday.
LinkedIn. A video view requires two or more continuous seconds of playback while the video is at least 50% on screen, explicitly aligned to the Media Rating Council standard. Total Watch Time includes replays while the video stays visible. Separately, since August 2024 LinkedIn reports video impressions and clicks only when they came from video ads that began to play, so LinkedIn video impressions are not comparable with pre-August-2024 data. (linkedin.com/help)
Facebook and Meta ads. ThruPlay counts a video played to completion or for at least fifteen seconds: for videos fifteen seconds or shorter it counts completion, and for longer ones it counts at least fifteen unique seconds played. Meta treats "full length" as at least 97% of the video, because people drop off during credits and fades. (facebook.com/business)
X and Threads. Be honest in your reporting here. X's public view-count help pages are not reliably reachable for automated verification, and Threads has no equivalent published counting spec at the granularity the others offer. Do not fill these rows from a vendor blog, which is how the wrong numbers spread in the first place. Open X's own help documentation on the day you build your report, record the definition and the date you checked it, and footnote both. An honest "definition unverified as of [date]" is worth more than a confident number you cannot source.
The spread across documented platforms runs from "first frame" to "fifteen seconds." Every competitor guide prints that range in one column labeled Views.
Milestone 3: Stop adding views across platforms
The rule is blunt: a cross-platform view total is not a real number. If your monthly report says 1.2M views and that figure sums YouTube (first frame), TikTok (start, no replays) and Instagram (plays, replays included), you have added seconds to dollars. Post the same clip everywhere and YouTube will hand you the largest number by construction, not by performance.
So what is comparable? Engagement rate, measured per platform against that platform's own median. Rival IQ's benchmark methodology defines engagement rate as likes, comments, favorites, retweets, shares and reactions divided by total follower count, sampled from 150 random companies in each of fourteen industries out of a 200,000-company database. Its 2025 report found year-over-year engagement rate declines on every major platform: X down 48%, Facebook down 36%, TikTok down 34%, Instagram down 16%. (rivaliq.com)
That reframes a result most teams treat as failure. If your Instagram engagement rate is flat year over year against a market that fell 16%, you gained ground. If your TikTok rate fell 10% against a market that fell 34%, you outperformed. Reporting "flat" as "no progress" is the most common self-inflicted wound in social reporting, and it usually costs someone a budget line.
Build your report as one engagement-rate column per platform, each with its own benchmark row underneath. Never a blended average. If you do need a single headline number for a leadership deck, use a downstream metric that is genuinely platform-agnostic: sessions, signups or revenue from tagged links. A consistent UTM structure is what makes that possible, and our guide to social media attribution covers the tracking setup in detail.
Milestone 4: Start from the decision, not the metric
A metric with no threshold is decoration. Here are six real decisions, the one metric that answers each, and the number at which you act. Treat the thresholds as defaults to calibrate against your own last 90 days, not universal law.
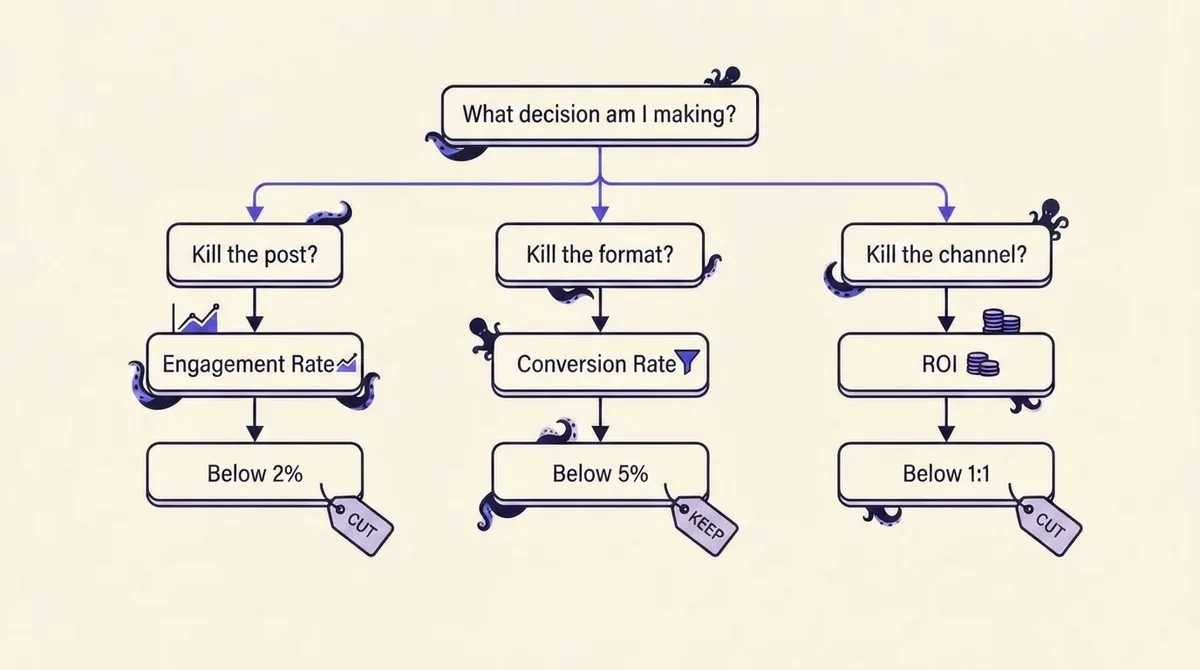
Decision 1: Should I delete or repost this individual post? Metric: engagement rate against your own trailing median for that platform. Threshold: below 50% of your 90-day median with at least 1,000 impressions or platform-native views. Action: do not delete it (deleting teaches you nothing). Note the hook and the first three seconds, and do not reuse that pattern.
Decision 2: Should I kill this format? Metric: median engagement rate across the last eight posts in that format, not the mean. Threshold: median below 70% of your all-format median across eight or more posts. Action: retire it for a quarter. Eight is the minimum because one viral outlier will drag a mean upward and keep a dead format alive for months.
Decision 3: Should I kill this channel? Metric: qualified downstream actions (signups, demo requests, sales) per hour of team time invested. Threshold: two consecutive quarters below one-third of your best channel's rate. Action: drop to a repurposing-only cadence rather than exiting entirely. Channel decisions need quarters because monthly channel data is almost never significant, and platform reach shifts are real: Pew Research Center's 2025 survey of 5,022 U.S. adults found 84% ever use YouTube, 71% Facebook, 50% Instagram and 37% TikTok, so audience availability differs by an order of magnitude before you post anything. (pewresearch.org)
Decision 4: Should I change my posting time? Metric: median first-hour engagement rate, bucketed by publish hour. Threshold: one bucket beating another by 25% or more across 20+ posts per bucket. Action: shift the slot. Below 20 posts per bucket you are reading noise.
Decision 5: Should I put money behind this post? Metric: organic engagement rate in the first 24 hours versus your median. Threshold: 2x median or better. Action: boost. Amplifying anything at or below median buys you a bigger version of an average result.
Decision 6: Should I change the hook or the topic? Metric: retention shape, not view count. Threshold: if more than 60% of viewers drop before the platform's own view threshold (two seconds on LinkedIn, six on TikTok's focused view), the hook is the problem. If retention is flat early and collapses mid-video, the topic is the problem. Action: fix the first three seconds, or fix the subject.
A worked example. An agency runs a client's carousel format for eight posts. Engagement rates: 1.9%, 0.7%, 4.4%, 1.1%, 0.9%, 1.2%, 0.8%, 1.0%. The mean is 1.5%, comfortably at the account's 1.4% all-format median, and the format survives another quarter. The median is 1.05%, which is 75% of the account median and inside the keep zone, but only just. The 4.4% post was a giveaway. Remove it and the median falls to 1.0%, or 71%. The correct read is that this format is one promotion away from failing Decision 2, and the next quarter's plan should test a replacement in parallel rather than assume the format works.
Milestone 5: Check whether the difference is real
Most social media managers act on differences that could not survive a coin flip. If Variant A gets 340 engagements on 12,000 impressions (2.83%) and Variant B gets 300 on 11,800 (2.54%), that gap is well inside normal variation for those sample sizes. Rerun it and the winner can flip.
Three practical rules, no statistics degree required:
- Do not compare single posts. Compare groups of at least eight posts per condition, and use medians. One outlier ruins a mean.
- Demand a big gap at small n. With a few thousand impressions per variant, only differences of roughly 25% or more in relative terms are worth acting on. A 5% difference needs tens of thousands of impressions before it means anything.
- Wait for the counts to settle. YouTube's own documentation warns that view, like, dislike and subscription counts may temporarily slow down, freeze, or change while YouTube validates which interactions are legitimate. (support.google.com) Instagram's
total_interactionscan fall retroactively when users unlike or delete comments. Reporting on a 24-hour window means reporting on unvalidated data.
A 72-hour reporting delay costs you nothing and removes most of the revision risk.
Milestone 6: Audit what your analytics tool is doing to your numbers
Third-party dashboards exist to give you one view of seven platforms. To do that, they have to map incompatible platform fields into shared columns, and that mapping is exactly where the error enters. Three things to check in whatever tool you use, including ours:
- What does the Views column contain per platform? If the tool cannot tell you which API field feeds each row, it is normalizing definitions it should be preserving.
- How is engagement rate calculated? Divided by followers, by reach, or by impressions? Each produces a different number from identical data, and vendors rarely agree. Later's formula (engagements divided by reach or followers) shows why: 500 likes on 5,000 followers is 10%, while 1,000 likes on 100,000 followers is 1%.
- Does it backfill or snapshot? A tool that snapshots on day one and never re-pulls will diverge permanently from native analytics as counts get validated and interactions get deleted.
We wrote a full breakdown of which vendors measure what in social media analytics tools, and a companion piece on what each tool actually measures is the right next read if you are shortlisting. OctoSpark keeps per-platform metrics addressable rather than blended, and exposes them through the same API and MCP surface your team and your agents already use, so an agent can query a platform's raw field rather than a normalized one. If you publish across multiple platforms, that distinction is the difference between a report and a guess.
Milestone 7: Report from native analytics honestly
Native analytics are free, authoritative, and the only place the platform's own definitions are guaranteed intact. Use them as your source of truth and your dashboard as your working surface.
- YouTube Studio: audience retention curves and traffic sources. Post-August 2026, report engaged views alongside views or your trend lines will lie.
- Instagram Insights: reach, plays, and interactions. Remember reach is estimated and impressions no longer exist for new media.
- TikTok Analytics: retention graph and traffic source. Replays excluded everywhere.
- LinkedIn Analytics: impressions, members reached, and demographic breakdowns by job function and seniority, which no other platform gives you free.
- Meta Business Suite: ThruPlay and the 97% completion definition for anything paid.
- X and Threads: read the definition off the platform's current help documentation on report day and cite it.
A clean monthly report is four elements: one engagement-rate column per platform with its benchmark, retention curves for your top and bottom video, downstream conversions from UTMs, and a one-paragraph decision log naming which thresholds fired. Everything else is decoration. If you are running client reporting, keeping the same structure across every account is what makes approvals fast, and scheduling consistently is what makes the sample sizes above achievable in the first place.
Common questions about social media analytics
What is meant by social media analytics? Collecting performance, audience, sentiment and competitor data from social platforms and using it to make a decision. If no decision follows, it is reporting.
What is the 5-5-5 rule for social media? A commonly taught daily habit: engage with five posts from people you follow, five from accounts you do not, and leave five thoughtful comments. It is a consistency prompt for community building, not a measured algorithmic mechanic, and no platform documents it. Treat it as a routine, not a growth lever, and measure it through profile visits and inbound DMs rather than reach.
What is social media data analytics? The engineering side of the same job: pulling data through platform APIs, normalizing it, storing it and querying it. The counting rules in Milestone 2 are the schema decisions you make when you build that pipeline. Our social media API guide covers the publishing and retrieval side.
Why did my Instagram impressions disappear? Meta deprecated the metric for media created after 2 July 2024. It exists only for older media. Use views and reach instead, and rewrite any report template that still compares the two.
Can I compare this year's YouTube views to last year's? Not directly. The definition changed on 24 August 2026. Compare engaged views year over year, and start a fresh views series from that date.
The short version: get your definitions right, benchmark within each platform, attach a number to every decision, and wait for the data to settle. If you want the publishing side wired to the same discipline, see how OctoSpark works or start free.