
Social Media Analytics Tools: What Each One Actually Measures

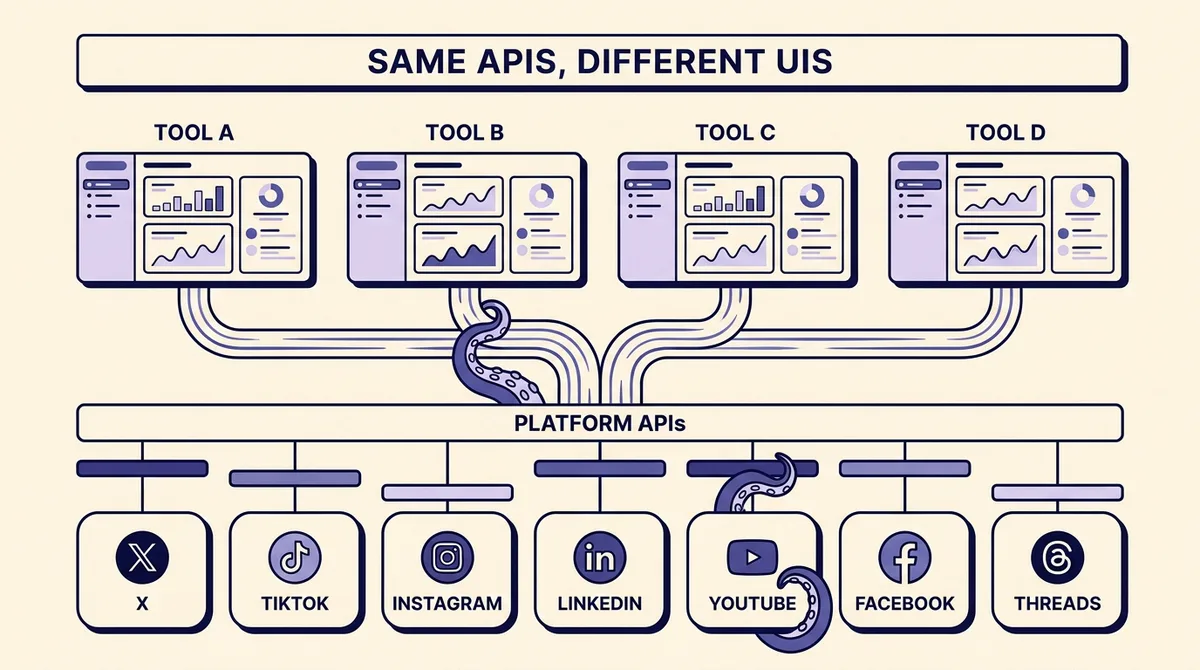
Search for social media analytics tools and you will get a dozen pages comparing dashboards: screenshot, feature checklist, pricing tier, repeat. What you will not get is an answer to the question buyers actually keep asking, which is why two tools connected to the same account report different numbers for the same post.
The answer is not that one vendor is better at math. Every tool in this category is a user interface over the same small set of platform APIs, and those APIs impose ceilings no vendor can lift. How far back your history goes, whether a deleted video still counts, what the denominator of your engagement rate is, whether your TikTok view counts came from TikTok at all: those are decided upstream of the product you are paying for. They are also public, documented, and wildly uneven between platforms.
So this guide is a chronological evaluation, not a listicle: seven milestones, from shortlist to signed contract, each one a specific thing to check before you commit a year of reporting to a vendor. The shortlist comes first because you do need one. It just matters far less than the six milestones after it.
Milestone 0: build the shortlist, then stop caring about it
Twelve products cover essentially the whole market, and they cluster into five jobs. Pick the cluster, then move on to the parts that actually vary.
- All-in-one suites with publishing plus analytics. Sprout Social, Hootsuite, Buffer, Metricool, Statusbrew, Planable. You schedule and measure in one place; analytics depth is broad rather than deep.
- Analytics-first products. Social Status, Socialinsider, Keyhole. No real publishing workflow, more granular metric breakdowns and export options.
- Competitive benchmarking and listening. Rival IQ, Brand24, BuzzSumo. Their differentiator is data about accounts you do not own, which is a different API path again and usually the least complete one.
- Report builders. Whatagraph, DashThis. They collect little themselves; they wrap connectors around other people's data and make it presentable for clients.
- Free native tools. Meta Business Suite, LinkedIn page analytics, YouTube Studio, TikTok's in-app analytics, and Google Analytics 4 for the traffic side. These are the reference implementation. Everything else is a copy.
That last bullet is worth sitting with. Native analytics are the only place a number is not a copy of a copy, which is why experienced practitioners treat native as the most reliable source. If you are also choosing a publishing layer, our guide to social media management tools covers that half of the decision.
Milestone 1: connect one account and watch exactly what backfills
Do this before you buy, on a trial, with a real account. Connect it, wait an hour, and note the earliest date with data in it. That single test settles more than any feature comparison, because vendor backfill claims are capped by platform retention no matter what the pricing page says.
Here is what the platforms document, verified as of August 2026:
- Facebook. The Insights API exposes only the last two years of data, allows a maximum of 90 days per query window, and most metrics refresh once every 24 hours.
- Instagram. User-level metrics are stored for up to 90 days. Not 18 months, not a decade. Ninety days, per Meta's Instagram Platform insights documentation.
- LinkedIn. The organization share statistics endpoint returns data only within a rolling 12-month window, and returns organic statistics only, with sponsored activity living in a separate Ads Analytics API entirely.
- LinkedIn followers. Time-bound follower statistics run from 12 months before the request date until two days before it. There is a permanent two-day hole at the recent end of the series.
- Threads. User insights cannot be returned for any date before April 13, 2024, and Meta's own docs say results are not guaranteed before June 1, 2024.
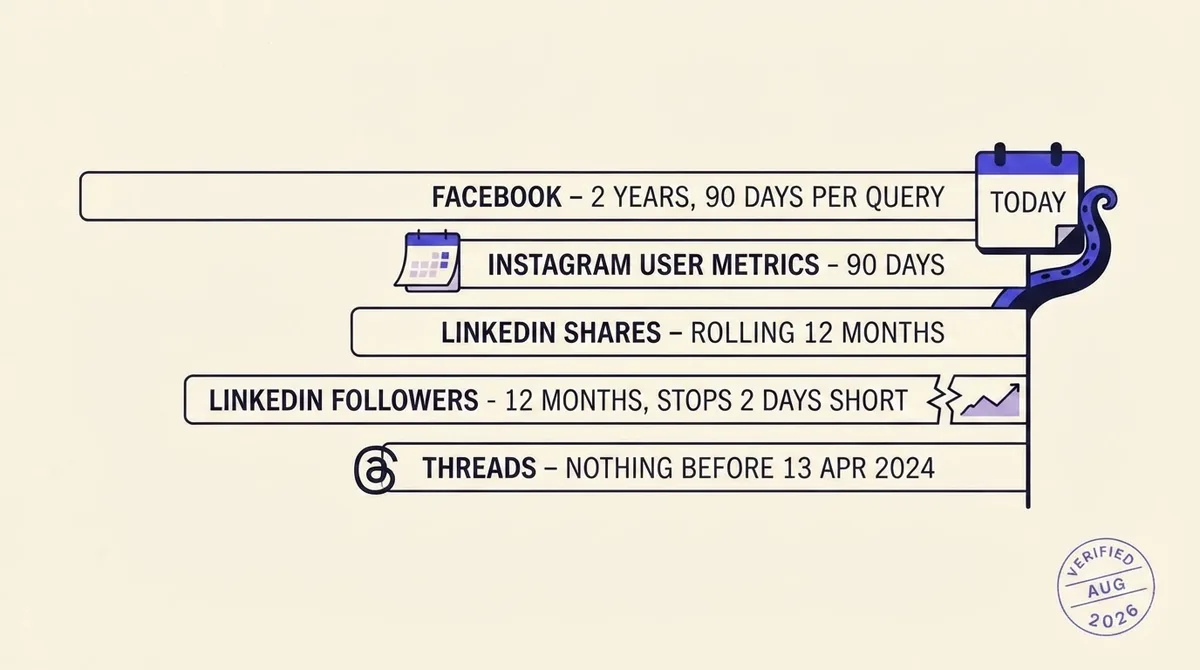
So when a vendor advertises 18 months of history, ask which platforms that applies to. It can be true for content the tool has snapshotted since you connected and simultaneously impossible for the 90 days before you connected. Those are different claims, and vendors rarely separate them.
The practical consequence: connect your accounts to whatever you are going to use months before you need the reporting. A tool that snapshots daily builds history you can never retrieve later. Waiting until Q4 to connect means Q1 through Q3 are gone for good on Instagram.
Milestone 2: pull one post into every tool and compare the engagement rate
Take a single post that performed well, find it in each shortlisted tool, and write down the engagement rate each one shows. They will disagree. This is the part that generates the most support tickets and the least documentation.
LinkedIn is the cleanest illustration because it ships its own answer. The share statistics API returns a platform-computed engagement field, defined in the schema as organic clicks, likes, comments, and shares over impressions. Most third-party tools instead divide interactions by follower count. A third group divides by reach.
A worked example with one set of numbers from one post:
- Impressions: 12,000
- Reach: 8,400
- Followers: 40,000
- Organic clicks, likes, comments, and shares: 480
- LinkedIn's own field, interactions over impressions: 4.0%
- A followers-based tool, interactions over followers: 1.2%
- A reach-based tool, interactions over reach: 5.7%
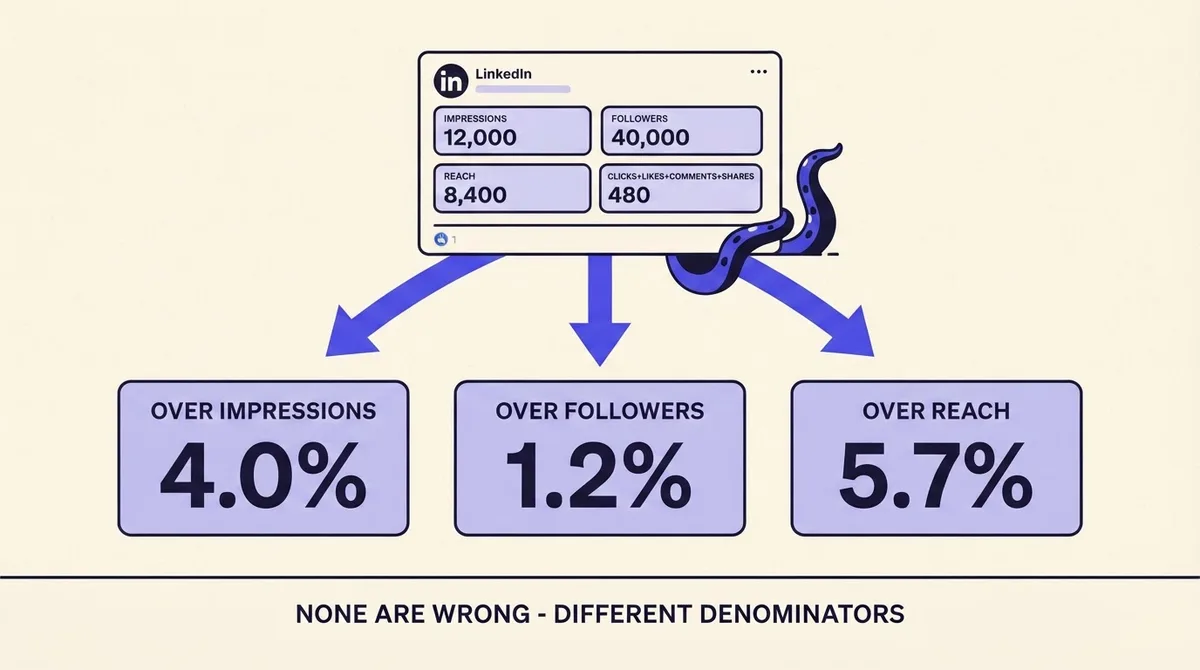
None of these is wrong. They answer three different questions: how compelling was this to the people who saw it, how much of my audience did it activate, and how compelling was it per unique human. The failure mode is not the math. It is putting number one in a January board deck and number two in February and calling it a decline.
If you cannot state the denominator of your engagement rate from memory, you cannot defend the trend line built from it.
Milestone 3: delete a post, then re-run last quarter
This is the check nobody performs and it silently corrupts quarter-over-quarter reporting. Archive or delete one piece of content, then re-run a report covering a period that included it, and compare against the version you exported earlier.
YouTube documents the sharpest version. In YouTube Analytics, aggregate reports include metrics for deleted videos while per-video reports exclude them. Your channel total will legitimately exceed the sum of your individual video rows the moment anything is removed: two report types, two definitions. The same page also warns that a report might not contain all, or any, of your data below undisclosed thresholds, which most often bites demographics, geography, and traffic sources on smaller channels.
Instagram has an expiring case: Live media can only be read while the broadcast is happening. If nothing captured it live, there is nothing to retrieve afterward.
And Instagram changed a definition mid-stream. The impressions metric was deprecated from API v22.0 and fully discontinued on April 21, 2025, replaced by views. Any Instagram time series that spans that date is comparing two differently defined numbers on one line.
So the question for a vendor is simple: do you snapshot, or do you re-query? A tool that stores a daily snapshot keeps showing what last quarter looked like at the time. A tool that re-queries on every report load will quietly return a different total for the same period, forever.
Milestone 4: ask where the TikTok numbers came from
This is the finding most likely to change a purchase decision, and it is not subtle.
TikTok's Display API is the general-access API for showing a creator's profile and videos. Per TikTok's own documentation, it returns open_id, avatar_url, display_name, profile_deep_link, and bio_description for users. There is no view_count. There is no like_count.
The API that does carry like_count, comment_count, share_count, and view_count is the Research API, restricted to academic institutions in the US, EEA, UK, or Switzerland, and to not-for-profit and independent research institutions. Applicants must be independent from commercial interests and conduct research on a non-commercial basis.
A commercial analytics vendor is, definitionally, not eligible for that path. So your tool's TikTok numbers arrive through a narrower route than its Instagram or LinkedIn numbers: business-account endpoints, whatever a connected creator account exposes, or estimation. That is precisely why TikTok figures disagree between tools more than any other platform.
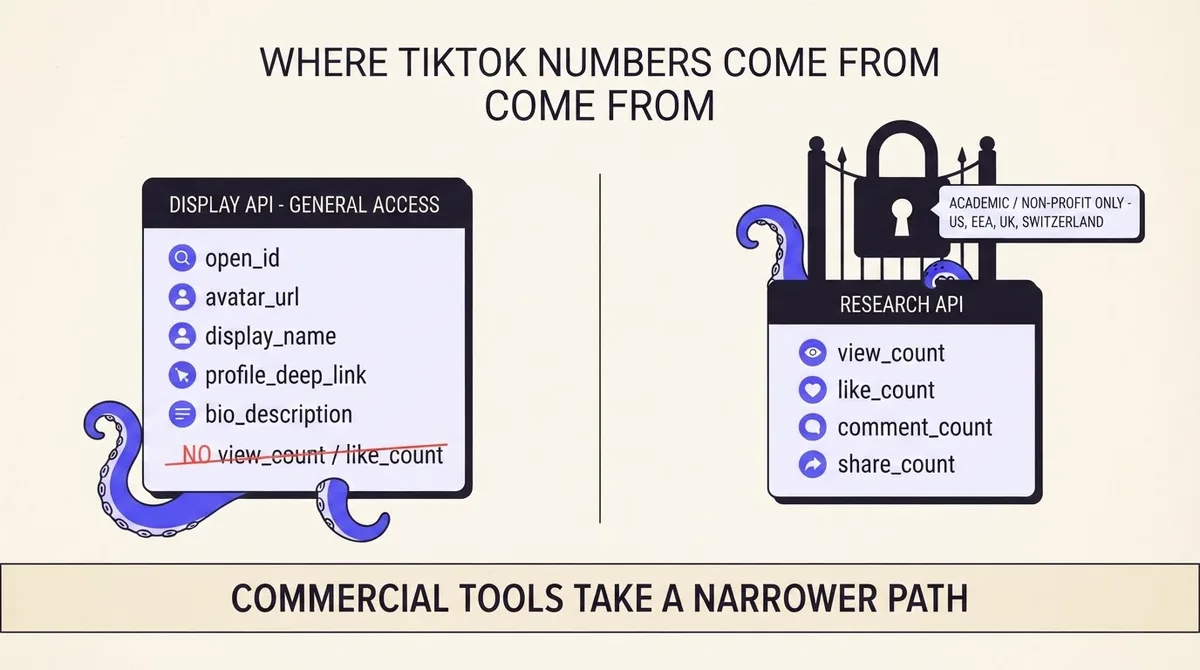
Ask the rep directly, in writing: is your TikTok view count first-party from a TikTok API, or is it derived? Both answers are workable. Not knowing which one you have is not.
Milestone 5: reconcile against the native app before you call it a bug
Before you open a support ticket, rule out the documented gaps. Most tool-versus-app disagreements are expected behavior, not defects.
- Instagram data may be delayed up to 48 hours, and with no date range specified the API looks back only 24 hours. Yesterday's post is supposed to look wrong.
- Facebook metrics refresh roughly once every 24 hours. Comparing a live app screen to an API-sourced dashboard at 4pm compares two different moments.
- YouTube's day dimension lags, and low-volume dimensions may be withheld entirely.
- LinkedIn follower series stop two days short of today by design, and time-bound queries return no demographic breakdown at all. Lifetime demographic facets are capped at the top 100 results per facet.
- Instagram thresholds hide metrics on small accounts. Under 100 followers,
follower_countandonline_followersare unavailable. Demographic metrics need at least 100 engagements in the window, breakdowns return only the top 45 results, and summing them gives a total below your real follower count.
If the gap survives all five checks, it is worth escalating. If it does not, you have just saved a week.
Milestone 6: the five questions for the sales call
Vendor-agnostic, and every one of them has a checkable answer:
- Which of the numbers on this screen does the platform return, and which do you compute? Ask for the list, not a reassurance.
- What is my backfill on connect, per platform, in days? Not "up to" across the whole product.
- Do you snapshot posts that later get deleted, or do you re-query the platform on every report load?
- What is your engagement-rate denominator, and is it configurable per report?
- Is TikTok data first-party from a TikTok API, or inferred?
A good rep answers four of these immediately and comes back on the fifth. A rep who answers all five with "our data is 100% accurate" is telling you they have not read the docs their product depends on.
The durable fix: own the raw numbers
Everything above points the same direction. The metrics you can trust across years are the ones where you hold the inputs and control the formula. If the only artifact of your reporting is a screenshot of a dashboard whose denominator you cannot see or change, you are one vendor migration away from a discontinuous trend line.
The durable fix is boring: pull raw counts on a schedule into somewhere you control, then compute derived metrics yourself, in code you can read. Interactions, impressions, reach, and follower count are the inputs. Engagement rate is your output, defined once, applied to every platform, auditable when a client asks.
This is why OctoSpark exposes analytics over the same API, CLI, and MCP surface as publishing rather than locking them behind a chart. The same interface that schedules a post can pull its metrics, so a nightly job can land them in your warehouse alongside the campaign metadata that gives them meaning. Your engagement-rate formula lives in your repository, versioned, and applies identically across every connected platform. When LinkedIn changes a field or Instagram retires a metric, you change one line and re-run history.
It also composes with the rest of the stack. Publishing cadence from your scheduling workflow and conversion data from your attribution setup join cleanly to metrics you own, and stay joined when you switch tools.
Frequently asked questions
What are analytical tools in social media?
They are products that connect to your social accounts through official platform APIs and present the returned metrics as charts and reports. Some numbers, such as impressions or LinkedIn's engagement field, come straight from the platform. Others, such as most engagement rates and best-time-to-post recommendations, are computed by the vendor from those raw values. Both appear in the same dashboard with no visual distinction, which is the root of most cross-tool disagreements.
What are the top 5 social media analytics tools?
By market presence, the five most commonly shortlisted are Sprout Social, Hootsuite, Buffer, Metricool, and Rival IQ, with Social Status and Socialinsider strong on analytics depth and Whatagraph and DashThis strong on client reporting. All read from the same platform APIs, so rank your shortlist on backfill, snapshot behavior, and export access rather than chart design.
What are the best free social media analytics tools?
The native ones: Meta Business Suite for Facebook and Instagram, LinkedIn page analytics, YouTube Studio, X and TikTok in-app analytics, and Google Analytics 4 for traffic and conversions. They are the source every paid tool copies from, which is exactly why they are the tiebreaker when a paid tool and the app disagree. Their weakness is cross-platform aggregation and history, not accuracy.
What are the top 5 social media management tools?
Management tools add scheduling, approvals, and collaboration to reporting. The usual shortlist is Hootsuite, Sprout Social, Buffer, Later, and Metricool, with OctoSpark aimed at teams that want the same actions from a dashboard, a terminal, and an AI agent. If publishing and measurement will live in one product, evaluate the analytics with the milestones above before the publishing UI wins you over. Plans and limits are on our pricing page.
One last thing. Re-verify these platform limits before you cite them in a contract. Every figure here is from first-party developer documentation checked in August 2026, and these ceilings move. The habit that survives every change costs nothing: know your denominator, know your backfill, and keep the raw numbers where you can reach them.