
LinkedIn Analytics for Company Pages and Personal Profiles

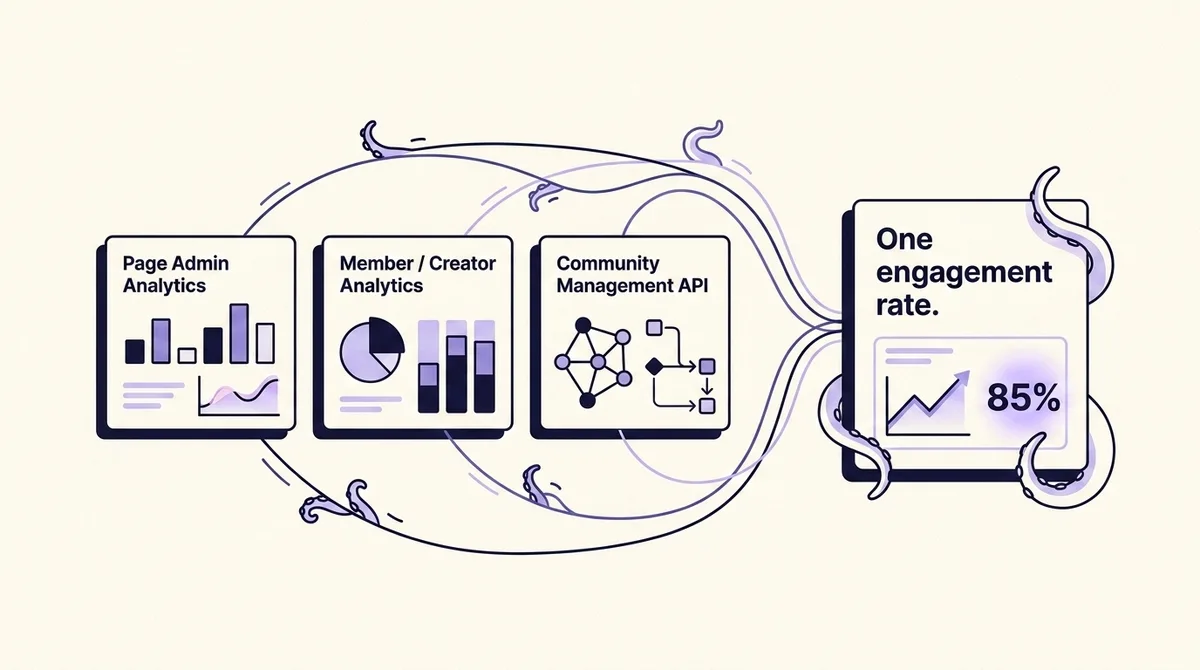
Ask five people what "LinkedIn analytics" means and you get three different products described as one. The founder means the impressions counter under their own post. The social media manager means the Content tab in the Page admin view. The person building an internal dashboard means an API endpoint with a scope attached to it. Google's own AI Overview for this query gives up on picking: it answers in two halves, then asks the searcher which one they meant.
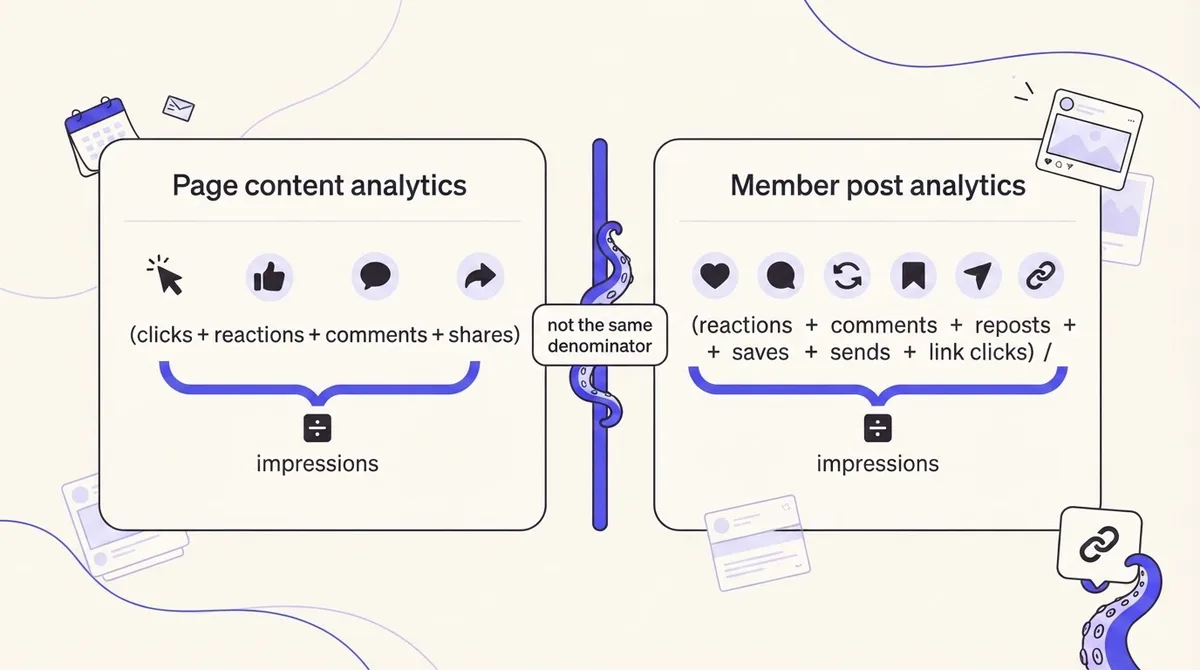
That ambiguity is not a search problem, it is a product problem. LinkedIn ships three separate analytics surfaces. They are governed by different permissions, they retain data for different lengths of time, they export in different file formats, and, the part that quietly wrecks reporting, they define engagement differently. Page content analytics divides interactions by impressions. The Community Management API divides organic interactions by impressions and drops sponsored activity. Member post analytics returns no rate at all, just raw counts you have to divide yourself.
So when a founder says "my personal posts get 4 percent and our company page only gets 2 percent," they are usually comparing two formulas over two denominators and reading the gap as a strategy insight. This walkthrough fixes that. It moves in order: identify which surface you are standing in, read each one correctly, reconcile them into one comparable engagement rate with a worked example, map what LinkedIn will actually keep and let you export, then decide whether the API is worth touching at all.
Milestone 1: Identify which of the three analytics products you are in
Before any number means anything, name the surface. There are exactly three, and the fastest way to tell them apart is who is allowed to look.
- Page admin analytics. Reached from the Page admin view, under Analytics. LinkedIn splits it into eight tabs: Content, Visitors, Followers, Search Appearances, Leads, Newsletters, Competitors, and Employer Brand. Access is not restricted to the owner: LinkedIn states plainly that "Analytics are available for all Page admin roles," and super admin, content admin and analyst can each view and export analytics (LinkedIn Help).
- Member and creator analytics. Reached from your own profile, under Analytics and tools. This covers combined post analytics, audience analytics, profile viewers and search appearances. Every member has it. Creator mode is not a prerequisite, which we will come back to because two of the biggest guides on this topic imply otherwise by omission.
- The Community Management API. Programmatic access to the same underlying data through endpoints like
organizationalEntityShareStatistics,organizationPageStatistics,organizationalEntityFollowerStatisticsfor Pages, andmemberCreatorPostAnalyticsfor a member's own posts. This is a vetted product, not an open API, and it is where most reporting ambitions go to die.
The three do not overlap cleanly. A Page admin cannot see a member's post analytics, even an employee's. A member cannot see Page visitor demographics. And the API surfaces some fields that no dashboard shows, while omitting others the dashboards do show. Write down which surface each number in your report came from, because in the next three milestones that provenance is the only thing that keeps the comparison honest.
Milestone 2: Read the Page tabs, and learn LinkedIn's own definitions
The Page tabs are the surface most guides describe, usually as a metric glossary. The more useful move is to note what question each tab is actually built to answer.
- Content answers "did this post work," with impressions, clicks, reactions, comments, reposts and an engagement rate per post.
- Visitors answers "who lands on the Page itself," separating page views from unique visitors and breaking them out by job function, seniority, industry, company size and location. Visitors are not followers, and treating a visitor spike as audience growth is the most common misread on the Page side.
- Followers answers "who subscribed and where did they come from," splitting organic from sponsored follower gains.
- Search Appearances answers "how often did the Page surface in LinkedIn search," which is the closest thing LinkedIn gives you to a discovery signal.
- Leads, Newsletters, Competitors and Employer Brand answer narrower questions: form fill performance, subscriber and article performance, side by side follower and engagement comparison against Pages you nominate, and how your Page performs as an employer.
Now the definitions, because this is where the reconciliation later hinges. LinkedIn defines Page content engagement rate as "the ratio of interactions per impressions on your post," where "interactions include clicks, reactions, comments, and shares." It defines impressions as "the number of times your post was shown on LinkedIn" and adds that "this number is an estimate and may not be precise." And it defines clicks narrowly, excluding "interactions, such as reposts, reactions, and comments," so clicks are not a superset (LinkedIn Help).
One operational note that saves hours: LinkedIn says "it might take 48 hours for metrics to be reflected, except for reactions and comments which reflect in real time." Reactions and comments moving while impressions stay frozen is expected behavior, not a bug. Stop refreshing the dashboard an hour after publishing, and never lock a weekly report before the trailing two days have settled.
Milestone 3: Open member analytics (no creator mode required)
Here is a claim worth correcting outright, because the two largest third-party guides on this SERP leave it unaddressed and readers fill the gap with folklore: you do not need creator mode to see creator analytics. LinkedIn's own help documentation states that "all LinkedIn members have access to creator analytics." That coverage includes combined post analytics, which "shows how your content performs over time," and audience analytics, which "provides insights about your follower growth trends and follower demographics," and the whole thing exports to .XLSX.
Combined post analytics spans short form posts, images, videos, events, polls and articles. The date range selector runs from the past seven days up to the past 365 days. It reports impressions with an in-network and out-of-network breakdown, engagements covering reactions, comments, reposts, saves and sends, and members reached.
That last trio is where the member surface diverges sharply from the Page surface, and it matters more than the tab layout does:
- Impressions versus members reached. LinkedIn defines impressions as the "number of times your post was shown on LinkedIn" and members reached as the "number of distinct members and Pages that saw your post" (LinkedIn Help). One is events, the other is people. A post with 12,600 impressions and 9,050 members reached was seen roughly 1.4 times per person.
- In-network versus out-of-network impressions. This is a distribution diagnostic the Page side does not give you. If out-of-network stays near zero, the post is circulating inside your existing connections and followers and nothing more.
- Saves and sends. These exist on the member side and have no Page equivalent. A send is a post forwarded in a direct message, which is the highest-intent signal LinkedIn exposes and the one that never appears in a Page engagement rate.
The consequence: member analytics gives you richer raw material and no rate. You get counts. The rate is your job.
Milestone 4: Compute one engagement rate that actually compares
This is the milestone that makes the rest of the report defensible. You have three definitions in play, so pick one and force the others into it.
Definition A, the Page dashboard. Interactions (clicks, reactions, comments, shares) divided by impressions.
Definition B, the API. The organizationalEntityShareStatistics endpoint returns an engagement field documented as the "number of organic clicks, likes, comments, and shares over impressions." Note the word organic: the docs state that "sponsored activity is not counted in this endpoint" (LinkedIn API docs). If you run paid amplification on a post, the API number and the dashboard number will legitimately disagree.
Definition C, member posts. There is no rate. The memberCreatorPostAnalytics endpoint returns raw counts across eleven metric types including IMPRESSION, MEMBERS_REACHED, REACTION, COMMENT, RESHARE, POST_SAVE, POST_SEND and LINK_CLICKS, with no engagement-rate field at all.
Here is a worked reconciliation using one Page post and one personal post from the same week.
Company Page post: 8,400 impressions, 210 clicks, 96 reactions, 18 comments, 7 shares. Interactions total 331. Engagement rate = 331 / 8,400 = 3.94 percent.
Personal post: 12,600 impressions, 9,050 members reached, 402 reactions, 55 comments, 12 reposts, 61 saves, 44 sends, 168 link clicks.
Compute three ways and watch the number move:
- Everything over impressions. 402 + 55 + 12 + 61 + 44 + 168 = 742. 742 / 12,600 = 5.89 percent.
- Page-comparable subset over impressions. Drop saves and sends, since the Page surface has no equivalent: 168 + 402 + 55 + 12 = 637. 637 / 12,600 = 5.06 percent.
- Page-comparable subset over members reached. 637 / 9,050 = 7.04 percent.
Three valid rates for one post, spanning 5.89 to 7.04, before you have compared anything to the Page at all. The only honest comparison against that Page post's 3.94 percent is line 2, the 5.06 percent, because it uses the same interaction set over the same kind of denominator.
The rules that follow from this:
- Normalize the numerator first. Decide whether saves and sends are in or out, then apply that decision to every surface. If they are in, your Page rates are structurally understated and you must say so in the report.
- Never mix denominators. Impressions and members reached are different populations. A reach-based rate will always read higher and always look like a win.
- Track the discarded signals separately. Do not throw saves and sends away to force comparability. Report them as their own line, because they are the strongest intent evidence LinkedIn hands you.
- Flag sponsored posts. If a post was boosted, the API rate excludes that activity. Keep boosted posts in a separate bucket rather than blending them into an organic average.
Our wider social media analytics guide works through the same normalization problem across other networks, where the denominator mismatch is usually reach versus followers rather than impressions versus reach.
Milestone 5: Map retention and exports before you promise a trend line
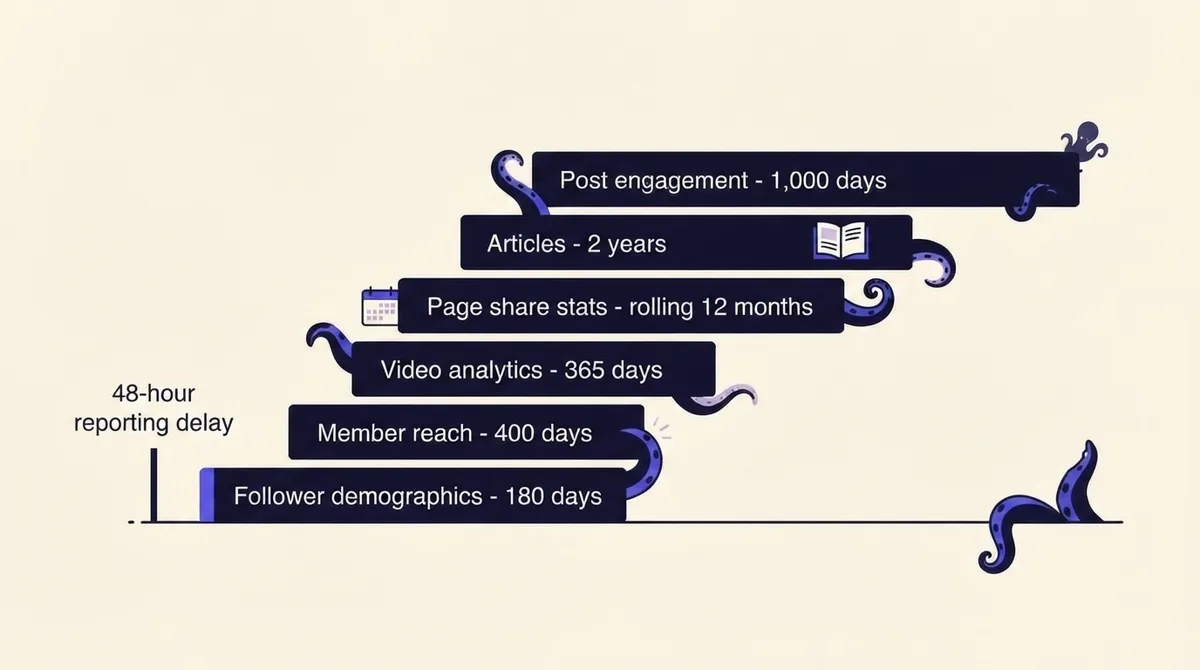
The fastest way to lose credibility is to promise a two-year trend on a metric LinkedIn keeps for six months. Retention is set per metric, not per surface.
On the member side, LinkedIn documents video analytics at 365 days, articles at 2 years, and for all other content, discovery and engagement data at 1,000 days, member reach at 400 days, and demographics at 180 days (LinkedIn Help). Read that carefully: engagement counts outlive the reach numbers you would divide them by. At day 500 you can still see how many reactions a post got and no longer see how many people it reached, so the rate is unrecoverable unless you stored it.
On the API side, organizationalEntityShareStatistics "returns share data only within the past 12 months, using a rolling 12-month window," and organizationalEntityFollowerStatistics returns time-bound statistics only from 12 months before the request date through to 2 days before it, while capping each demographic facet at the top 100 results.
Exports differ too, in both format and scope. Page analytics exports as an XLS file, available for the Content, Visitors, Followers and Competitors tabs via Page admin view, Analytics, the tab, Export, then a timeframe. Member and creator analytics export as .XLSX. Different formats, different column sets, different tabs covered, which is precisely why merging them by hand in a spreadsheet each month goes wrong.
The practical rule: anything you want a multi-year trend on, you have to store yourself. Set a monthly export cadence now, dated and archived, or accept that your history ends where LinkedIn's retention does.
Milestone 6: Decide whether the API is worth touching
The implicit claim in a lot of agency-facing content is that native analytics is the ceiling and the only way past it is a tool. That is not true, and pretending otherwise is a disservice. LinkedIn has a real analytics API. It is just gated.
What it costs you to get there:
- Scopes are surface-specific. Page-level share, page and follower statistics require
rw_organization_admin, which LinkedIn describes as managing organization pages and retrieving reporting data, restricted to organizations where the authenticated member holds the ADMINISTRATOR role. Member post analytics requires an entirely separate permission,r_member_postAnalytics. One integration, two approval paths. - Tier gating. The Community Management API is vetted. The Development Tier allows limited call volume with default limits around 500 requests per app and 100 per member. Moving to the Standard Tier requires an application that includes a screencast video demonstrating each use case.
- Rate limits you cannot plan around in advance. Limits reset at midnight UTC daily, exceeded requests get a 429 response, and LinkedIn states that Standard rate limits are not published in documentation. You only see them in the Developer Portal's Analytics tab, after you are approved.
- Field-level oddities. The docs warn that
likeCount"can become negative when members who liked a sponsored share later unlike it," and member analytics counts are "best-effort accurate and shouldn't be used for billing purposes." Build defensively or your dashboard will show a negative reaction count one morning and nobody will trust it again.
The honest build-versus-buy call: if you manage one or two Pages and want a monthly report, the native exports plus a stored archive are enough. If you need cross-account or cross-platform reporting, the API is the right architecture but the vetting, tiering and unpublished limits make it a multi-week project with ongoing maintenance, not a weekend script. Our builder's guide to social media APIs covers what that lifecycle looks like across networks.
That middle ground is where a management platform earns its place. The real pain agencies describe is not missing metrics, it is that each Page needs a separate login and export, there is no way to pull data across accounts at once, no way to combine LinkedIn data with other platforms, and no scheduled recurring exports. OctoSpark exists in exactly that gap: it pulls Page and profile-level performance into one report with a single normalized engagement rate, so the three-surface split stops being your problem. Because the same reports cover every connected network in one place, the LinkedIn number sits next to the others on one definition instead of three. If you are still comparing vendors, our roundup of social media analytics tools breaks down what each one actually measures, and the Instagram equivalent shows how differently the same question resolves on another network.
Milestone 7: Ship a report that answers a business question
A report is not a metric dump. Start from the question, then pick the surface that owns the answer.
- "Are we reaching the right people?" Page Visitors and Followers demographics, plus member audience analytics. Impressions are irrelevant here; job function and seniority mix are the answer.
- "Is our content working?" Normalized engagement rate from Milestone 4, split by format, with saves and sends reported separately on the member side.
- "Is the founder's profile outperforming the Page?" Only answerable with the reconciled rate. Report the formula next to the number.
- "Is any of this generating pipeline?" Page Leads tab plus tagged link clicks. LinkedIn will not attribute revenue for you.
On benchmarks, be careful with the number that circulates most. The widely repeated "2 percent or higher is strong" is unsourced on the pages that publish it. Socialinsider's 2026 study, which analyzed 1.3 million posts from 16,645 business pages between January 2024 and December 2025 and calculated engagement rate by dividing engagement by impressions then multiplying by 100, reports a 5.20 percent average, with native documents at 7.00 percent, multi-image at 6.45 percent, video at 6.00 percent, image at 5.30 percent, text at 4.50 percent, polls at 4.20 percent and link posts at 3.25 percent (Socialinsider). Those two claims are not really in conflict, they are counting different things over different denominators. That is the entire theme of this article: before you compare a rate to a benchmark, check that the benchmark's formula matches yours.
Why your numbers keep changing after you check
The 48-hour latency. Reactions and comments update in real time while everything else settles, so a Monday morning number and a Wednesday number for the same post are both correct.
Why the export does not match the dashboard to the decimal
LinkedIn says impressions are an estimate and may not be precise, and its API docs describe counts as best-effort accurate and unsuitable for billing. Reconcile to trends, not to individual units.
Is 10,000 impressions a lot?
Unanswerable on its own, because impressions scale with audience size. Convert it to a rate first, then compare against a benchmark computed the same way. Ten thousand impressions with 120 interactions is 1.2 percent, well below the Socialinsider average. Ten thousand with 600 is 6 percent.
Do I need creator mode?
No. LinkedIn states all members have access to creator analytics. Creator mode changes how your profile presents, not whether analytics exist.
Start at Milestone 1 with the surface, end at Milestone 7 with the question, and keep the formula printed next to every rate you publish. That single habit resolves most LinkedIn reporting arguments before they start. If you want the reconciliation handled for you rather than rebuilt each month, see how OctoSpark prices it.