
Instagram Analytics Tools and What Instagram Will and Will Not Give You

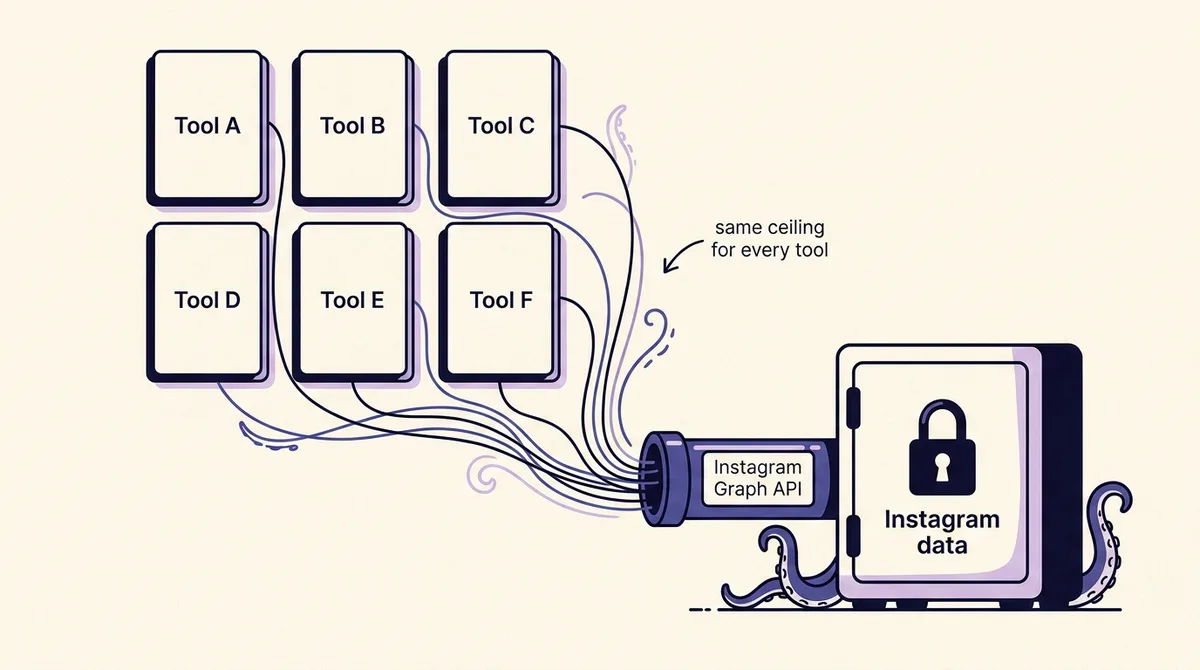
Every roundup of Instagram analytics tools is written as if each vendor owns its own data. It does not. With one narrow exception, every tool you will see on every list reads the same Instagram Graph API, using the same permissions, under the same rate limits and the same retention rules. That single fact reshapes the buying decision: no tool can show you a metric Instagram does not expose, and no tool can show you data Instagram has already thrown away.
So the useful question is not "which tool has the best analytics?" It is "which tool does the four things the API refuses to do for me?" Those four things are: keeping history after Instagram's 90-day storage window closes, capturing Story metrics inside their 24-hour life, rolling multiple accounts into one comparable view, and turning raw numbers into something a client or a founder will actually read. Everything else on a feature list is theatre.
This guide leads with the API contract, because that is the part nobody publishes, then uses it as a scoring rubric for the tools. By the end you will know which tool to buy, why it costs money, and the specific cases where free native Insights is genuinely enough.
Start here: the shared ceiling every tool sits under
Instagram exposes analytics through the Instagram Platform APIs. A tool authenticates either through Instagram Login against graph.instagram.com or through Facebook Login against graph.facebook.com with a linked Facebook Page, and in both cases the connected account must be an Instagram professional account, Business or Creator (Meta, Instagram Platform overview). Reading insights for a Business account linked to a Page requires the instagram_manage_insights permission, which requires App Review plus the instagram_basic, pages_read_engagement and pages_show_list dependencies (Meta permissions reference).
Three consequences follow immediately, and they apply to Sprout, Later, Metricool, Iconosquare, Buffer and everything else equally:
- Personal accounts get nothing. Insights are available only for professional accounts, never personal ones. Any product promising analytics for a personal account is either asking you to convert first, or scraping.
- Analytics are per account. Meta's documentation states you can only get insights for one user at a time. Every "portfolio view" is a tool stitching separate calls together after the fact.
- Volume is capped by your own reach. The standard rate limit formula is
Calls within 24 hours = 4800 * Number of Impressions, where impressions means content views in the previous day. Small accounts have small budgets, which is why some tools refresh a 5,000-follower account less often than a 500,000-follower one.
If you want the equivalent breakdown for other networks, our social media analytics tools pillar covers how each platform's API constrains what a dashboard can display.
What the API exposes in 2026, and the four metrics Meta killed
Graph API v22.0, released 21 January 2025, deprecated four Instagram insight metrics: plays and clips_replays_count on media insights, ig_reels_aggregated_all_plays_count on media insights, and impressions on both media and user insights. views replaced them. The changelog notes the deprecations "Will apply to all versions April 21, 2025" (Graph API v22.0 changelog).
The migration rule is precise and it is the single most common cause of a chart that looks broken. Meta states: "API requests with the impressions metric will continue to return data for media created on or before July 1, 2024 for v21.0 and older. API requests made after April 21, 2025 for media created on or after July 2, 2024 will return an error." So a two-year Instagram chart is physically split down the middle: impressions on the left of 2 July 2024, views on the right, and they are not the same measurement. A tool that silently plots them as one line is lying to you politely.
What you can read today at the media level includes views, reach, likes, comments, saved, shares, reposts, total_interactions, profile_visits, profile_activity, navigation, follows, link_clicks, crossposted_views, facebook_views, ig_reels_avg_watch_time, ig_reels_video_view_total_time and reels_skip_rate (media insights reference). At the account level: accounts_engaged, comments, engaged_audience_demographics, follows_and_unfollows, follower_demographics, likes, profile_links_taps, reach, replies, reposts, saves, shares, total_interactions and views.
A few sharp edges buried in the same docs, each of which shows up as a support ticket somewhere:
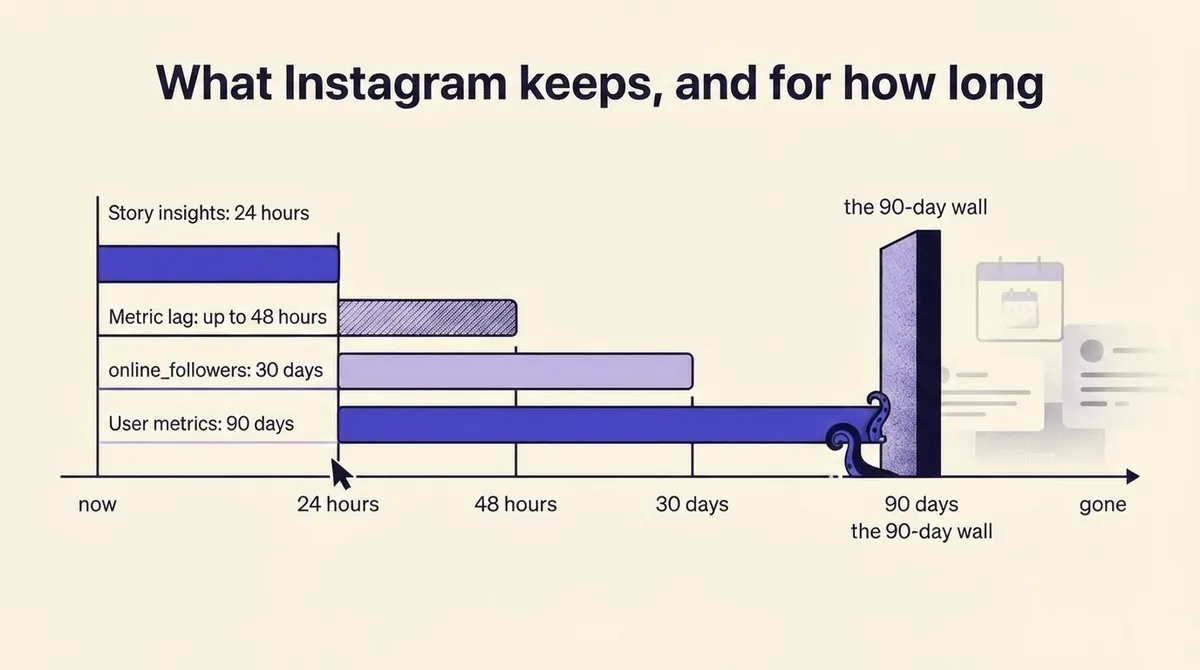
- Metrics can lag by up to 48 hours. Yesterday's post is not finished reporting.
- Insights are not available for individual media inside a carousel. You get the album, not the third slide. Any "best slide" analysis is inference, not data.
- Live video media can only be read while the broadcast is live.
- An unavailable metric returns an empty data set, not 0. How a tool renders that gap (blank, zero, or interpolated) is a real product difference.
- If you omit
sinceanduntilon account insights, the API defaults to a 24-hour lookback.
Native Instagram Insights: free, immediate, and four hard limits
The in-app Insights tab and Meta Business Suite are the reference implementation. They are free, they need no App Review, and for a single account posting a few times a week they are frequently sufficient. Instagram's own help documentation describes viewing insights on an aggregate or individual post basis for any time period within the past 90 days, with preset ranges plus a custom option (Instagram Help Center); personal accounts get only a reduced 30-day dashboard covering views, interactions and new followers.
The four limits that eventually push teams off native Insights are not opinions, they are the API contract:
- Ninety days and no further. "User Metrics data is stored for up to 90 days" (Instagram Insights docs). Day 91 is gone from Instagram, permanently.
- One account at a time. No cross-account comparison, no brand-versus-brand rollup.
- Small accounts get less. "Some metrics are not available on Instagram accounts with fewer than 100 followers."
- No export worth the name. You cannot build a quarterly narrative out of screenshots.
If all four of those are tolerable for you, stop reading the tool section. Native Insights plus a monthly spreadsheet is a legitimate answer, and it is the right answer more often than the roundups admit.
The 90-day wall and the 24-hour Story window: what you are actually paying for
Here is the mechanic that explains every price tag on this market. A third-party tool connects, then starts polling and storing. From connection day forward it has its own copy of your numbers, so its history is not capped at 90 days: Instagram's is. Which means the value of a paid tool compounds with tenure, and it starts at close to zero.
That produces a rule most vendors will not say out loud. Backfill is capped at 90 days, once. Sign up today and the deepest history any tool can hand you is the last 90 days of user metrics, no matter what tier you buy. Cancel for four months and come back, and the gap in the middle is unrecoverable. So the correct time to start paying is before you need the reporting, and switching tools mid-year costs you continuity even when the new tool is better.
Stories are the harsher case. Story insights are available only within 24 hours of creation, and the API returns error code 10 for Stories with fewer than 5 viewers (media insights reference). Meta offers a story_insights webhook, but its documentation is explicit: "Notifications for story_insights events will only show metrics for the first 24 hours, before the story expires, even if the story is a highlight" (Instagram webhooks). There is no general webhook for post or account insight metrics.
So Story analytics are a race. A tool that subscribes to the webhook, or polls aggressively before expiry, keeps your Story data forever. A tool that syncs once a day at 3am captures whatever was still alive at 3am and loses the rest, silently. If Stories are a real channel for you, this is the single most differentiating question you can ask a vendor, and almost nobody asks it.
One more European and Japanese footnote: for Stories created by users in Europe and Japan, the replies metric returns 0. Not "low engagement" and not a bug in your tool. A regional rule in the API.
Competitor and demographic data: real, scraped, or impossible
Metricool's own documentation concedes that competitor engagement "is calculated differently from your own account, since Metricool can only see public data." That is honest, and here is the underlying reason it does not explain.
The sanctioned route is the Business Discovery API. It returns only public metadata about other professional accounts: followers_count, media_count, and public media fields such as comments_count, like_count and view_count. It requires Facebook Login, it returns no data for age-gated professional accounts, and a direct GET on any IG Media it returns fails for insufficient permissions (Business Discovery docs). No reach. No impressions or views on the account level. No saves. No demographics. Any competitor "reach" figure is an estimate derived from likes and comments against follower count, and it should be labelled as such.
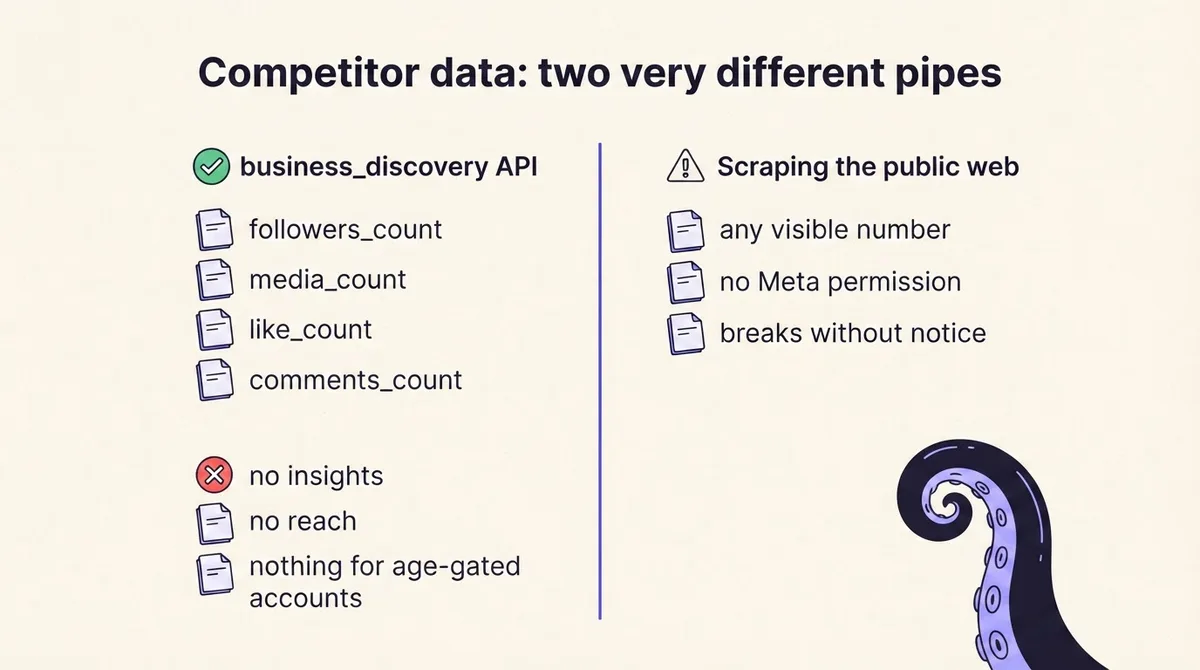
The alternative is scraping the public web, which is what several of the free "check any account" tools that rank at the top of this search are really doing. It works until it does not, it operates outside Meta's permission model, and it can disappear between one month's report and the next. That is a fine trade for a one-off curiosity check and a poor foundation for a client deliverable.
Your own demographics have their own trap. Follower demographics are "Not returned if the IG User has less than 100 followers"; follower_count and online_followers are also unavailable below that floor; online_followers covers only the last 30 days; and demographic metrics use period=lifetime with a timeframe such as last_90_days that overrides since and until (user insights reference). Read that last clause carefully: demographics are a current-state snapshot, not a time series. When your tool shows "audience by country" for March, it is showing you today's audience, filtered by a date picker that the API ignored. You cannot prove your audience shifted from 40 percent US to 55 percent US over a year unless something stored monthly snapshots for you. A tool that quietly does that is worth real money.
Eight questions that expose real differences
Run these at the vendor, not at the feature page. Answers that arrive fast and specific are themselves a signal.
- How far back does history go after I connect, and how far back does it go after two years? Correct answer: 90 days now, unlimited later. Anything claiming deep instant backfill is scraping or bluffing.
- Do you capture Story insights inside 24 hours, via webhook or scheduled polling? Ask for the mechanism, not a yes.
- Do you store monthly demographic snapshots? If not, you have no audience trend line, ever.
- How do you handle the impressions-to-views boundary at 2 July 2024? Ideal: two separate series, clearly labelled.
- What is your engagement rate denominator? Followers, reach, or views, and can I change it?
- How do you render missing data? Empty is not zero. A tool that plots zeros will invent fake crashes on your charts.
- How do you compute competitor metrics?
business_discoveryor scraped, stated plainly. - Can I export raw rows, not just a PDF? Own your history so a future migration is survivable.
The tools, scored on the four axes that matter
Each entry below is judged only on history retention, Story capture, multi-account rollup and reporting, because those are the only axes where vendors genuinely differ. Pricing moves constantly, so verify current tiers before committing; the bands describe posture, not a quote.
Free, and honest about it
- Instagram Insights (native). Best possible freshness, zero retention past 90 days, one account, no export. Perfect for a solo creator, useless for a quarterly board deck.
- Meta Business Suite. Same data, adds Facebook alongside Instagram and a slightly better desktop workflow. Still no long-term retention and still no client-ready reporting.
- Socialinsider free tools and similar calculators. Useful one-shot engagement checks. No storage, so no trend.
- Public-account checkers (Instrack, Not Just Analytics, Socialstats and friends). These read public pages, not your insights. Good for a quick competitor sniff test, unsuitable for anything you invoice against.
Solo and small-team paid tiers
- Metricool. The most transparent product on this market about what is API-derived versus public. Strong post and Reel breakdowns, competent multi-account handling, reporting good enough for a small client roster. Weakness: demographics are current-state, as its own docs admit.
- Pallyy. Clean, cheap, calendar-first, decent visual reporting. Retention and Story handling are the things to interrogate before you rely on it.
- Buffer. Excellent for publishing plus lightweight analytics. Reporting is presentable but shallow if you need per-Reel retention curves.
- Later. Strong visual planning, Instagram-native feel, adequate analytics. Buy it for the calendar, tolerate the analytics.
Instagram-deep specialists
- Iconosquare. Among the deepest Instagram-specific metric coverage, with genuine historical charting and solid scheduled reports. The default choice when Instagram is the channel that matters most.
- Social Status. Report-generation specialist. If your output is a monthly PDF or slide deck for a client, this is the shape it was built for.
- Socialinsider (paid). Benchmarking and competitor framing, with clearer methodology labelling than most.
- Keyhole. Hashtag and campaign tracking alongside profile analytics; useful when the question is about a campaign, not an account.
Agency and mid-market suites
- Sprout Social. Deep cross-network reporting, best-in-class report builder, priced accordingly. Ask specifically about Story capture and demographic snapshots before assuming they exist.
- Agorapulse. Strong inbox plus reporting, good ROI framing, sensible per-profile pricing for agencies.
- Vista Social and Sendible. Multi-brand rollups and white-labelling at a lower price point than the enterprise tier, with correspondingly less depth per network.
- Brand24. Listening rather than owned-account analytics. Complementary, not a substitute.
If you also need publishing in the same place, our social media scheduling tools comparison sorts the same vendors by publishing workflow rather than by data. OctoSpark's own Instagram post scheduler covers the publishing half and exposes the same account data through an API and MCP, so an AI agent can query it directly instead of screenshotting a dashboard.
Agencies: rollups, white-label reports, and client access
Because the API returns insights for one user at a time, every multi-account view is a synthesis. That has practical fallout worth planning around.
- Per-profile pricing is the real cost driver. Twelve clients on three networks is 36 profiles. Price the shape of your roster, not the headline tier.
- Token expiry is your outage risk. Every connection depends on a client's professional account and, on the Facebook Login path, a linked Page. When a client's marketing hire leaves and their access is revoked, your dashboard stops collecting, and the 90-day wall keeps moving. Set up a monthly connection audit.
- Onboarding a client mid-engagement gives you 90 days of history, once. Connect the account the day the contract is signed, before kickoff, or you will spend the first quarter reporting on a partial baseline.
- White-label is genuinely vendor-differentiated. Logo, domain, sender address, and read-only client logins vary widely, and this is one of the few areas where you are paying for engineering rather than for data.
Our guide to social media management for agencies goes further into the operating model, and OctoSpark's client approvals covers the review loop that usually sits next to reporting.
Which metrics to act on, and how to diagnose a reach drop
Act on the metrics that indicate intent rather than reflex. saves and shares signal that a post had utility past the scroll. profile_visits, profile_links_taps and link_clicks are the closest thing Instagram gives you to a conversion trail. follows attributed to a specific media tells you which post recruited. reels_skip_rate and ig_reels_avg_watch_time tell you where the video lost people. Likes tell you very little on their own; our social media analytics guide walks through building this into a weekly review.
Engagement rate deserves one paragraph of arithmetic, because it is the most common source of tool disagreement. A Reel with 40 likes, 6 comments, 22 saves and 12 shares has 80 interactions. Against 1,900 reach, that is 4.2 percent. Against 2,600 views, 3.1 percent. Against 5,000 followers, 1.6 percent. Same post, three defensible numbers. Pick a denominator, write it down, and never mix them in one chart.
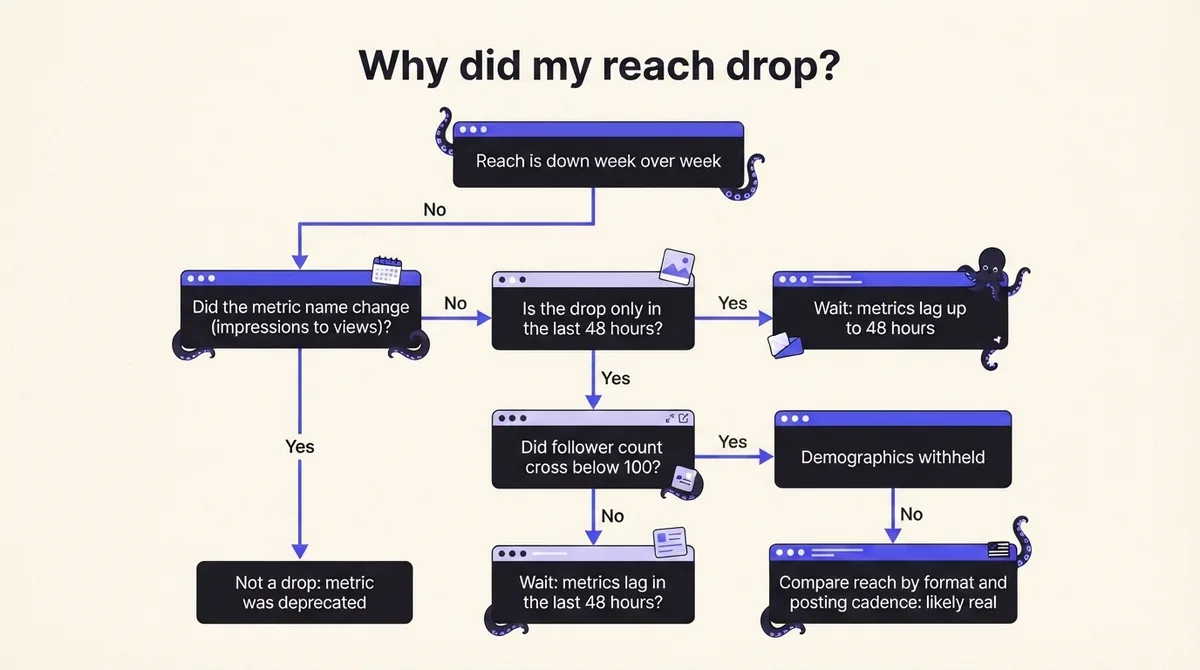
When reach appears to fall, work the diagnostic in this order:
- Is the drop inside the last 48 hours? Metrics lag up to 48 hours. Wait, then re-check.
- Does the drop start near 2 July 2024, or April 2025? Then you are looking at the deprecation boundary, not a decline.
impressionscounted repeat views;viewsis a different definition, and the series should not be joined. - Did the metric go empty rather than low? An unavailable metric returns an empty data set, and some tools draw that as zero.
- Did your posting mix change? Reels, carousels and statics reach differently, and carousel insights arrive album-level only, so a shift toward carousels changes what is even measurable.
- Only then treat it as real, and compare reach against
accounts_engagedandfollowsto see whether you lost distribution or lost resonance.
FAQ
Are Instagram analytics tools accurate? They are exactly as accurate as the API, because that is their only source. Where two tools disagree, the cause is almost always one of three things: the 48-hour reporting lag sampled at different times, the impressions-to-views migration handled differently, or a different engagement rate denominator.
Can I get analytics for a personal account? Not through any tool. Insights require a professional account. Personal accounts see a reduced 30-day in-app view of views, interactions and new followers.
Why can I not see my demographics? Follower demographics are not returned below 100 followers, and neither is follower_count or online_followers.
Can a tool recover my Instagram data from last year? No. User metrics are stored up to 90 days. Anything older exists only if a tool was already storing it.
Why are my Story replies always zero? For Stories created by users in Europe and Japan, replies returns 0 by rule.
Can I analyze a competitor's reach? No. Business Discovery returns follower and media counts plus public post counts, with nothing for age-gated accounts. Reach and saves are private.
Can ChatGPT or another AI agent analyze my Instagram? Only if it can reach the data. An agent cannot log into Instagram for you, so it needs an API or MCP connection to a tool that already holds your history. That is the pattern our social media API guide walks through, and why OctoSpark exposes the same endpoints to agents and humans. Start on pricing if you want the history clock running today rather than 90 days from now.
When is free genuinely enough? One account, a 90-day horizon, no client reporting, no Story archive. That describes a lot of solo creators, and there is no shame in staying there until one of those four conditions changes.