
Best Time to Post on Social Media, Based on Our Post-Level Data


There are two large, credible, first-party datasets on the best time to post on social media. Sprout Social analyzed nearly 2 billion engagements across roughly 307,000 social profiles. Buffer analyzed over 52 million posts. They reach opposite conclusions. Buffer names Sunday at 9 a.m. as the single best time to post anywhere. Sprout, and the AI Overview that cites it, says Sunday is the weakest day on almost every network.
Both cannot be right, and the disagreement is not about sample size, because both samples are enormous. It is about measurement. One of these studies counts engagements. The other measures median engagement per post. Those are different questions, and only one of them is the question a social media manager is actually asking.
This guide does something the rest of this search results page does not do. It audits the method behind the numbers, checks the timing claims against what Instagram, TikTok, YouTube, X and LinkedIn have published about their own ranking systems, and then tells you where posting time genuinely moves results and where the platforms themselves say it does not. Some of the most confident numbers in circulation describe surfaces where the operator of that surface has stated in writing that upload time is not a long-term factor.
The short answer, by platform and by surface
Here is the honest version of the summary block every guide on this topic opens with. Instead of a single hour per network, it states whether posting time is a documented ranking input on that surface, because that determines whether an hour-level recommendation is worth anything at all.
- Instagram Feed: timing matters. Instagram's own ranking explainer names information about the post, which includes when it was posted, as a main Feed signal.
- Instagram Stories and Reels: different systems, different signals. A single Instagram best time conflates three ranking surfaces.
- X: timing matters, as a hard deadline. The open-sourced ranking code applies an age filter that removes posts older than 48 hours before scoring.
- LinkedIn: timing matters, but the standard metric does not. LinkedIn Engineering optimizes dwell time and models the probability that a member skips your post.
- TikTok For You feed: publish time is not in TikTok's published list of recommendation factors.
- YouTube video on demand: YouTube Help states publish time is not known to affect long-term performance. Live streams and Premieres are the exception.
- Facebook and Threads: no published surface-level ranking documentation comparable to the above, so treat any hour-level claim as a hypothesis to test on your own account.
That block does not give you seven tidy hours. It is deliberately not doing that, because handing you an hour for YouTube video on demand would mean contradicting YouTube's own documentation in order to sound more useful.
Why "most engagement happens at 11 a.m." does not mean "post at 11 a.m."
This is the single most important idea in this article, and it is why two huge datasets disagree.
Sprout defines its metric as the total volume of interactions a post receives during a given timeframe, covering reactions, comments, shares, direct messages and link clicks. That is an absolute count. Absolute counts in an hourly bucket are confounded by how many posts were published in that bucket.
Work through it. Suppose 10,000 brands post at 11 a.m. and 500 post at 4 a.m. Even if the average 4 a.m. post outperforms the average 11 a.m. post on a per-post basis, the 11 a.m. bucket will still show vastly more total engagement, simply because it contains twenty times more posts. A heatmap built on that metric is a picture of publishing behavior wearing the costume of a recommendation. It tells you when marketers post. It does not tell you when to post.
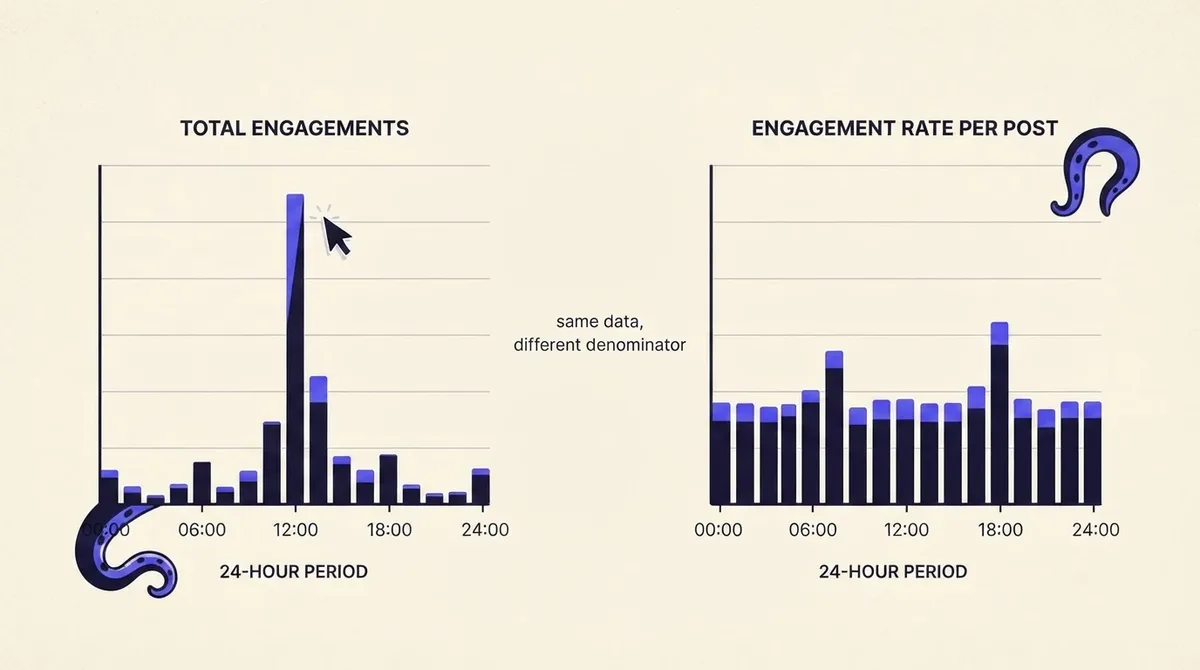
Buffer's median engagement per post is a genuine improvement, because a median per post has a denominator. But Buffer's analysis publishes no date range and no account count. Without a date range you cannot tell whether the finding has aged past a ranking change, and without an account count you cannot judge whether the median is drawn from a handful of very large accounts or a long tail of small ones. It cannot be replicated and it cannot be aged.
Neither study normalizes by follower count. A post from an account with 2 million followers and a post from an account with 2,000 followers contribute to the same hourly bucket. If large accounts cluster their publishing at particular hours, and they do, because they run on scheduled workflows, those hours inherit a follower-count advantage that has nothing to do with the hour.
The estimator we think is correct has three properties. It uses engagement rate per post, not a count. It normalizes by follower count, so a large account cannot dominate a bucket. And it accounts for how many posts competed in the same slot on the same network. That is not a bigger dataset than Sprout's. It is a better estimator, and on this question a better estimator beats a bigger sample, which is exactly what the Buffer versus Sprout contradiction proves.
How we build our dataset, and where the sample is thin
We run our posting-time panel on data from accounts that publish through OctoSpark across all seven networks, and we hold ourselves to rules that we would want applied to anyone else's study.
- Rate, not count. Every figure is engagement rate per post against the reachable follower base at publish time, never a total interaction count.
- Volume normalization. Each hourly slot is adjusted for the number of competing posts from the panel in that slot on that network.
- Stated date range and refresh cadence. Every release names its window, and the panel refreshes on a fixed cadence so you can tell how stale a figure is.
- Confidence intervals, published. A point estimate without an interval is not a finding.
- Outlier rules, published. Posts boosted with paid spend, posts from accounts below a minimum follower floor, and posts that a platform later removed are excluded, and the exclusion rules ship with the numbers.
- Insufficient sample means insufficient sample. Where a network-hour cell does not clear our minimum count, we print that phrase instead of a number. Threads and YouTube are the thinnest cells in our panel today, and we say so rather than filling the gap.
That last rule is the one competitors will not copy, because a heatmap with holes in it looks worse than a heatmap without them. It is also the only version of the chart that does not mislead you. If you want a broader view of how measurement choices distort reporting, our guide on social media attribution strategies covers the same failure mode in conversion reporting.
What the platforms themselves say about posting time
Nothing on page one of this search results page cites the platforms' own engineering documentation. It contradicts the confident hour-level claims repeatedly.
YouTube: the platform says upload time does not drive long-term performance
YouTube Help states that publish time is not known to impact a video's long-term performance, and that its recommendation system aims to deliver the right videos to the right viewers regardless of when the video was uploaded. Publishing when your audience is active can help early viewership, and publish time genuinely matters for Live and Premiere formats, which YouTube says explicitly. YouTube directs creators to the "When your viewers are on YouTube" report specifically to schedule Premieres and live streams. That is the only timing use case YouTube itself endorses.
So when a guide prescribes a specific hour for long-form YouTube uploads, it is making a claim the platform's own documentation does not support.
TikTok: publish time is not in the named factor list
TikTok's explanation of how the For You feed works names three factor groups: user interactions such as videos you like or share, accounts you follow, comments you post and content you create; video information such as captions, sounds and hashtags; and device and account settings such as language preference, country setting and device type. Publish time is not among them.
TikTok also states that neither follower count nor whether an account has had previous high-performing videos are direct factors in the recommendation system. Two of the assumptions built into most timing advice, that you ride your existing audience and your track record, are explicitly denied on the surface where most creators are chasing reach.
X: a 48 hour cliff, not a six hour half-life
SEO blogs routinely describe a six-hour engagement half-life on X. The open-sourced ranking repository shows something different: an age filter during the pre-scoring filter stage that removes posts older than 48 hours from consideration entirely, before scoring happens at all. That is a cliff, not a decay curve, and ranking and visibility filtering are separate systems in the published pipeline.
The practical implication changes your strategy. A cliff means your window is wide but finite, and that reposting a strong idea after the window closes is a legitimate move rather than a hack.
Instagram: recency is real, but it is one of three systems
Instagram's ranking explainer names information about the post, which includes popularity metrics and when it was posted, as a main Feed signal, alongside your activity, information about the person who posted, and your history of interacting with them. Recency is explicitly a Feed signal, which makes Instagram the strongest case for timing advice on this list.
But Stories run on viewing history, engagement history and closeness, and Reels use another signal set again. A single "best time for Instagram" number silently averages three ranking systems. If you post Reels and Feed carousels on the same schedule, you are applying one system's evidence to another. Our Instagram peak posting times guide goes deeper on the Feed-specific case.
LinkedIn: the standard metric does not measure what LinkedIn rewards
LinkedIn Engineering measures two kinds of dwell time: dwell on the feed, which starts measuring when at least half of a feed update is visible as a member scrolls, and dwell after the click, the time spent on content after clicking through. It states that click and viral actions can be rare, especially for passive consumers of the feed, that they are primarily binary indicators, and that clicks are noisy indicators of engagement. In response it built a model predicting the probability that a member's dwell time falls below a threshold, and adjusted feed ranking accordingly.
Read that against the metric both leading studies use. Likes, comments and shares are exactly the sparse, binary, noisy signals LinkedIn says it moved away from. A best-time-for-LinkedIn number built on likes and comments is optimizing a proxy the platform has publicly deprioritized.
Does the same audience respond at different hours on different networks?
This is the question the existing studies structurally cannot answer, and it is the reason we built the panel.
Sprout's and Buffer's datasets are collections of different accounts on different networks. When Buffer reports a peak hour for LinkedIn and a different peak hour for TikTok, you cannot tell whether that gap reflects the networks or the fact that the LinkedIn accounts in the sample serve a different population of humans than the TikTok accounts do. Audience and network are confounded. No amount of extra data separates them, because the design cannot.
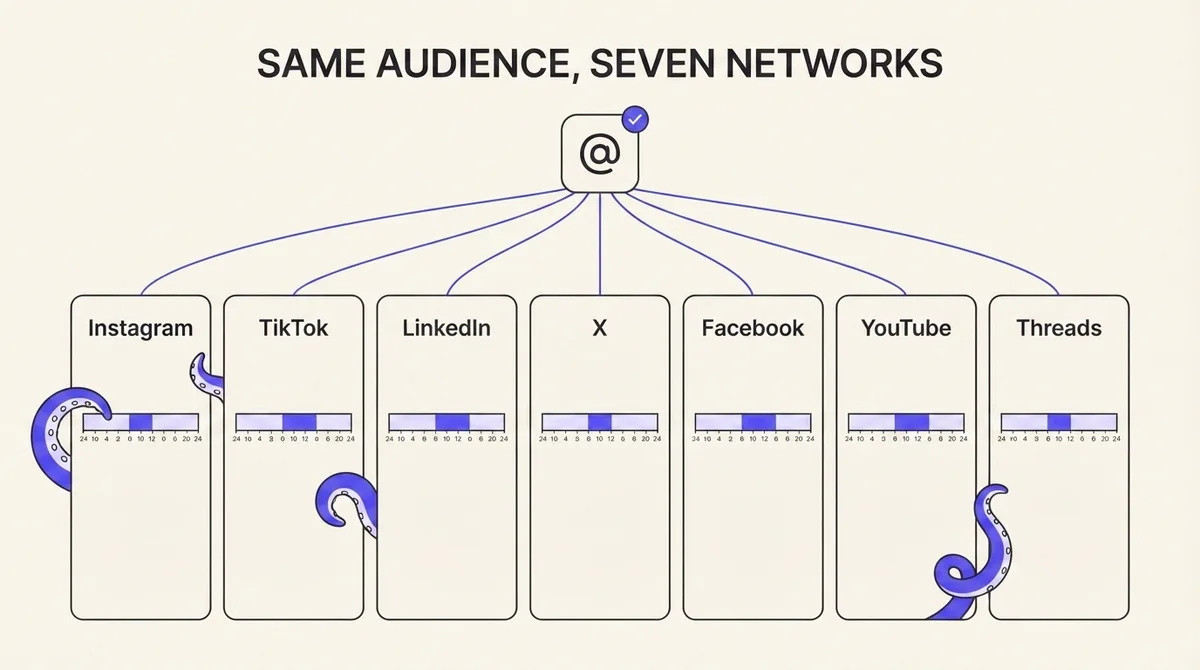
OctoSpark publishes and measures across X, TikTok, Instagram, LinkedIn, YouTube, Facebook and Threads from the same accounts. That lets us hold the brand constant and vary only the network, which is the design that isolates a platform effect from an audience effect. The interesting output is not a prettier heatmap. It is the answer to a question your reporting probably assumes without checking: when your own followers show up on Instagram at one hour and on LinkedIn at another, is that your audience's daily rhythm, or is it two ranking systems weighting recency differently?
Our early read is that the split is real and that it is larger between surface types than between networks. Feed-style surfaces with an explicit recency signal cluster together. Recommendation-style surfaces with no published time factor look flat by comparison. We publish the interval alongside every cell so you can see how confident that read is, and we mark the thin cells rather than smoothing over them. If you run one brand across several networks, our cross-platform distribution guide covers how to stagger the same idea without duplicating the same schedule.
Best day to post: Sunday, Monday, Friday and Saturday
Day-of-week refinements are the largest unserved layer on this topic, and the leading studies do not table them explicitly.
Sunday is where the two big datasets openly disagree. Buffer names Sunday 9 a.m. as the strongest slot overall. Sprout and the AI Overview call Sunday the weakest day on nearly every network. Under our reading, both results are consistent with each other once you fix the metric: Sunday has low posting volume, so it looks weak on an absolute count and strong on a per-post rate. That is the volume confound doing exactly what we described, in public, on the biggest question on this page.
Monday carries a professional-network effect. On LinkedIn, Monday concentrates the return-to-work feed session, which raises competition as well as attention. Higher competition can cancel a higher-attention window, and only a volume-normalized rate can tell you which won.
Friday decays through the afternoon on business-oriented surfaces and holds up better on entertainment-oriented ones. This is the clearest example of why segmenting by surface beats a single global recommendation.
Saturday looks like Sunday on the metric question: low publishing volume, so absolute counts understate it. If you have historically avoided weekends because a heatmap told you to, you may have been reading a chart of your competitors' habits.
The operational takeaway is unglamorous. Day-of-week effects are smaller than content-quality effects on every surface we measure, and they are smaller than surface-type effects. Fixing what you post will beat fixing when you post, every time.
Where posting time genuinely does not matter
Worth stating plainly, because no page on this search results page does.
On YouTube video on demand, the platform has published that upload time is not known to affect long-term performance. On the TikTok For You feed, publish time is absent from the named factor list. On both surfaces, the recommendation engine's job is to find the right viewer whenever that viewer arrives, which is the opposite of a chronological feed's job.
If you manage all seven networks, that reallocates your effort. Timing discipline belongs on Instagram Feed, X and LinkedIn, where recency is either documented or hard-coded. On YouTube and TikTok, the same hours of work are better spent on the hook, the caption, the sound and the thumbnail. Scheduling those two networks is still worth doing for consistency and for your own operational sanity, but not because a particular minute will unlock reach.
Adam Mosseri, who runs Instagram, has said publicly that there is no universal best time to post. The Reddit thread ranking near the top of this query is titled around whether best time to post is a myth, and it is full of practitioners who tried the published hours and saw nothing. Both are correct about the published global numbers and both are wrong about the underlying question. There is no universal best hour. There is very likely a best hour for your account on your recency-weighted surfaces, and it is findable.
How to find your own best time to post in 14 days
The method matters more than the starting hours. Run this as a real test.
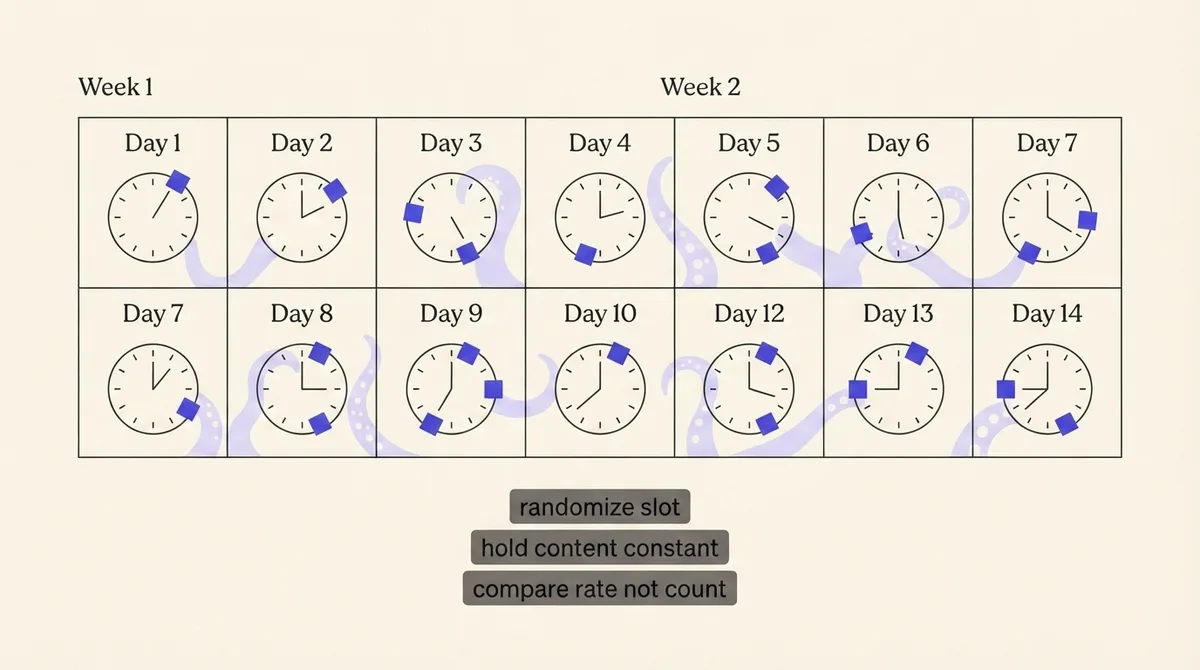
- Pick one network and one surface. Instagram Feed, not Instagram. Do not test Feed and Reels in the same run.
- Choose four candidate slots from your own audience-activity report, not from a published global table. Spread them across the day, and include at least one slot you assume is bad.
- Rotate slots, do not block them. Posting Monday through Wednesday at 9 a.m. and Thursday through Saturday at 5 p.m. confounds hour with day. Randomize the assignment so each slot lands on a mix of weekdays.
- Hold content type constant. One format for the whole run. If you mix a carousel, a Reel and a link post, you are measuring format, not timing.
- Record rate, not count. Divide engagement by reach or by followers at publish time for every post, and log it consistently.
- Run at least 20 posts before drawing a conclusion. With four slots and 14 days, that means roughly one or two posts a day. Fewer than 20 and the noise will swamp the effect.
- Expect a small effect, and act only if the interval clears zero. If your best slot beats your worst by a margin smaller than the variance between individual posts, your answer is that timing is not your bottleneck. That is a useful result.
Running that cleanly by hand is tedious, which is why most teams never do it. A social media scheduler that publishes to all seven networks and records post-level results in one place turns this into a single test setup rather than seven spreadsheets. If you are choosing tooling for this, our comparison of social media management tools covers what to look for in the reporting layer specifically.
Frequently asked questions
What is the best time to post on social media overall? There is no defensible single answer, and any source giving you one is either using an absolute engagement count, which is confounded by posting volume, or is not publishing enough about its method for you to check. The best available answer is per surface: prioritize timing on Instagram Feed, X and LinkedIn, and deprioritize it on YouTube video on demand and the TikTok For You feed, based on those platforms' own documentation.
Why do Sprout Social and Buffer disagree about Sunday? Because they measure different things. Sprout counts total interactions in a timeframe, which rewards hours with high posting volume. Buffer reports median engagement per post, which does not. Sunday has low posting volume, so it looks weak on the first metric and strong on the second. The disagreement is a measurement artifact, not a data quality problem.
Does the algorithm punish posting at the wrong time? No published platform documentation describes a penalty for posting at a particular hour. X applies a 48 hour age filter before scoring, and Instagram names when a post was shared as a Feed signal. Those are ranking inputs, not punishments, and neither TikTok nor YouTube lists publish time as a recommendation factor at all.
How often should best-time data be refreshed? At minimum, after any announced ranking change on a network you rely on, and otherwise on a fixed cadence with the window stated. A study with no published date range cannot be aged, which means you have no way to know whether it survived the last ranking update.
Should I post more often instead of worrying about timing? Usually, yes, up to the point where quality drops. Content and format effects are larger than hour-of-day effects on every surface we measure. If you are choosing between optimizing your schedule and improving your hooks, improve the hooks.
What about Threads and Facebook? Neither has published surface-level ranking documentation comparable to Instagram's explainer, X's open-sourced repository or LinkedIn's engineering posts. Our own sample on Threads is still thin, so we mark those cells insufficient rather than publishing a number we would not defend. Treat any confident Threads hour you read elsewhere as untested.
The position worth taking
The reason a skeptical Reddit thread outranks most of the professionally produced guides on this query is that readers can tell when a number has no method behind it. The fix is not a bigger dataset. It is a denominator, a stated window, a published interval, and the willingness to write "insufficient sample" where the data does not reach.
If you want to run the 14 day test on your own accounts across all seven networks with post-level results in one place, you can start free or compare plans on our pricing page. The answer that matters is the one your own audience gives you.